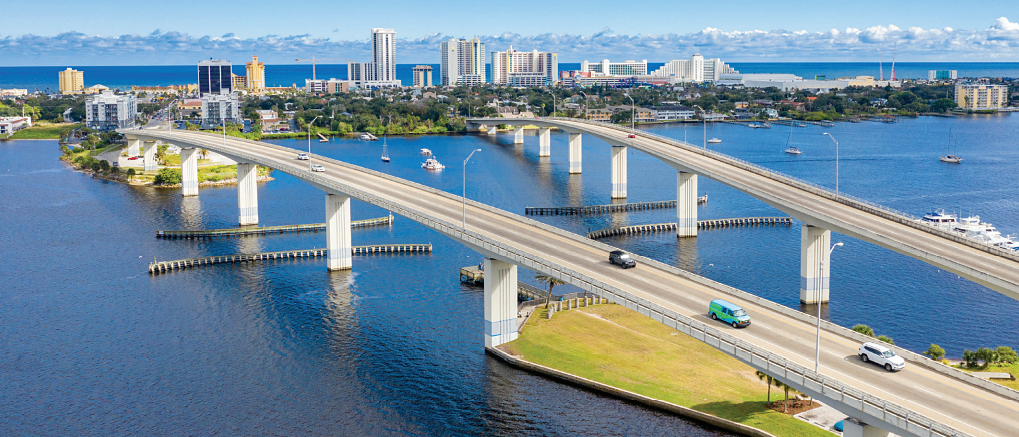
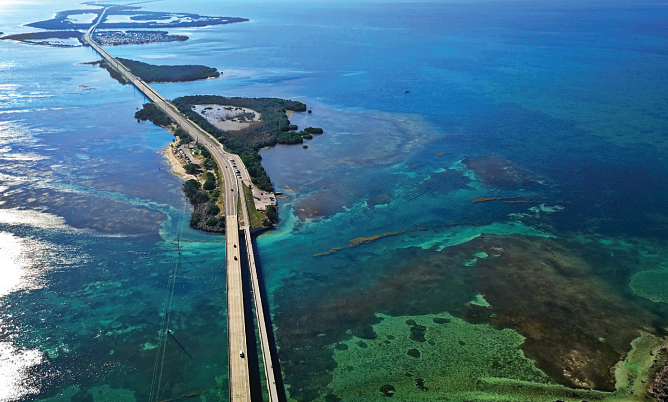
Three sites on Florida’s coast were chosen as locations for a corrosion study to establish the best technique for categorizing the environmental severity of exposure sites in regards to corrosion attack.
The sites in this study include the Battelle Florida Materials Research Center in Daytona Beach, Florida, USA; the NASA Kennedy Space Center (KSC) Beachside Atmospheric Corrosion Test Site, Florida, USA; and the U.S. Naval Research Academy, Key West, Florida, USA.
Knowing the corrosion severity of a particular environment is important when designing and maintaining infrastructure—and even more so in coastal environments. Certain factors can cause corrosion rates to vary significantly. The interaction amongst factors such as temperature, humidity, location, weather, etc. are complicated, so different methods for identifying corrosion severity are used.
Study Guidelines
In this study, researchers David J. Borth and Douglas C. Hansen (University of Dayton Research Institute, Dayton, Ohio, USA), along with Gregory Wolters (School of Engineering, University of Dayton) tracked site-specific weather parameters, mass loss of 1018 steel, and pitting characteristics of uncoated aluminum alloy (AA) 7075-T6 over a period of 12 months.1
Upon conclusion of the study, they ranked the three locations with respect to corrosion behavior in both steel and aluminum.
The first step in the procedure involved preparing the coupons. The scientists did this by cutting the steel and aluminum into 3 in by 0.5 in (7.62 cm by 1.27 cm) samples. The samples were ground, rinsed, and dried. The mass of each coupon was then determined. Additional details of the coupon preparation can be found in the conference paper.1
Upon deployment, the 12 samples were placed on an exposure rack. The Daytona and Key West samples faced south, while the KSC sample faced east. They were all angled at 30 degrees from the horizontal rack and were 3 to 5 ft (0.91 to 1.52 m) off the ground. The coupons were retrieved every quarter (at 3, 6, 9, and 12 months).
The researchers followed a process to clean both the aluminum and steel coupons, which was repeated until the recorded mass had reached a constant value.
The chloride deposition was measured via the wet candle method, pit characterization was determined by using a confocal laser microscope, and environmental data were collected hourly at each site.
Initial Findings

Figure 1 shows the general damage factors of steel mass loss and aluminum volume loss for each three-month period. For both steel and aluminum, the KSC site fared the worst.
For this study, the researchers used the 99th percentile values to represent the worst case damage for pitting and to exclude any outliers. They used this method because averages are not useful since most pitting is small, shallow pits.
This has the potential to skew the average to a low value that doesn’t change substantially between sites. They note that volume-wise, most of the damage comes from a few large pits. Because no one single metric provides the full picture, the scientists took pit volume, depth, cross-sectional area, and density into consideration.
In the AA7075-T6 coupons, lateral pit growth was more common than depth penetration, making mass loss determinations problematic and unreliable. For the 1018 steel coupons, mass loss data clearly showed an increase in corrosion rate over time at all three locations. However, analysis of the pitting on AA7075-T6 in terms of cross-sectional area and volume loss indicate a logarithmic increase over time for the three sites.
So even though mass loss of steel coupons can be used as indicators of corrosion severity, mass loss for the AA7075-T6 is an unreliable parameter to use for determining corrosion severity in the field. Figure 2 shows the lateral propagation of the pits in the Daytona and KSC coupons by quarter.

Confounding Factors
Three confounding factors were identified in this study. First, the exposure rack at the KSC site faced east (toward the offshore Atlantic Ocean), while the other two faced south. This could potentially lead to greater salt deposition on the surfaces of the samples.
Conversely, an east-facing sample would face the rising sun, drying the sample earlier in the morning, allowing for less time for corrosion to occur. The KSC is still likely the worst site; however, for this reason, it might not be as bad as the data suggest.
Second, the samples from the Key West site had to be cleaned considerably more than the other two sites because the researchers had difficulty in achieving a stable mass value. And third, the site deployments were each offset by one quarter, making it challenging to make generalizations regarding trends in a particular season.
Final Results

This study indicated that chloride deposition was the greatest factor in determining the corrosion behavior of the samples. It was found to be the only metric that differentiated among the three sites, underscoring the importance of collecting pollutant deposition data to ascertain the severity of a location.
Interestingly, these pitting characteristics of the steel and aluminum substrates demonstrated a strong positive correlation to cumulative salt deposition, but not to other weather parameters, such as exposure to various levels of relative humidity for various lengths of time.
Final results revealed that KSC had the greatest amount of damage, followed by Daytona, and then Key West. The 1018 steel accelerates with time in power trends and the AA7075-T6 follows a more variable trend best approximated by logarithmic decay.
Borth, Hansen, and Wolters plan to develop a more sophisticated method for comparing populations of pits on metal surfaces in future work. They will investigate how that relates to corrosion degradation and weather conditions. Additionally, they will prioritize standardization of site variables—including sample direction and coordination of deployment schedules—to increase the value of the data gathered.
Reference
1 D.J. Borth, D.C. Hansen, G. Wolters, “Corrosion Severity Comparison of Three Beach Sites,” AMPP 2022, paper no. 17668 (Houston, TX: AMPP, 2022).
