Studies have shown that visible—and possibly severe—corrosion occurs in dense phase carbon dioxide (CO2) at water-unsaturated conditions when trace amounts of impurities are present. Such impurities include dioxygen (O2), hydrogen sulfide (H2S), sulfur dioxide (SO2), and nitrogen dioxide (NO2). In these cases, corrosion can be attributed to interactions amongst chemical species.
It is common knowledge that carbon steels (CS) do not corrode when dry CO2 is present, and that during water-unsaturated conditions in dense phase CO2, an inconsequential amount of corrosion occurs.
Prior studies have examined the internal corrosion of pipelines and the effect of the flow due to carbon capture and storage, enhanced oil recovery, and deep water oil and gas production. One such study explored how the flow rate of different water concentrations affected steel corrosion in supercritical CO2. A higher flow rate was found to considerably increase the corrosion rate. It must be noted though that this study only examined the effect of the water and did not consider additional impurities.
Because data are limited in relation to corrosion behavior in flowing supercritical CO2 conditions that include different impurities, and this corrosion is of significant concern in transmission pipelines used to transport CO2, researchers Martin Colahan, Yoon-Seok Choi, and Srdjan Nesic with the Institute for Corrosion and Multiphase Technology, Ohio University (Athens, Ohio, USA), sought to better understand the physicochemical attributes on the corrosion of CS in the high-pressure environments associated with CO2 transmissions pipelines. In the study,1 they identified and quantified the effect of flow on the integrity of CS in supercritical CO2 with different impurities—water (H2O), SO2, O2, and nitric oxide (NO).
They performed a sequence of autoclave tests to determine the effect of flow on the corrosion of X65 CS. To test this, the researchers added impurities of different combinations and concentrations in supercritical CO2 condition.
The test specimens used in the experiment were machined from a low-CS (UNS K03014) of two different sizes: one size for the stagnant tests and one size for the flowing tests. The researchers used 600 grit silicon carbide paper to grind the samples. They were then cleaned with alcohol in an ultrasonic bath, dried, and weighed.
A Hastelloy autoclave was used in which the samples were affixed to holders and hung from the lid. The lid was then attached, and the autoclave was purged through several cycles of pressurization (with CO2) and depressurization. The N2-purged deionized water was put in just before pressurization with impurities and CO2 began. Technical-grade SO2, O2, and NO cylinders were used to add the impurities through a gas injection system (Figure 1).
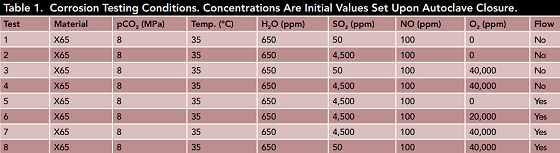
The detailed test conditions are presented in Table 1. The experiment results revealed that no corrosion was observed in the supercritical CO2 with 650 ppm of water, 50 ppm SO2, and 100 ppm NO. A moderate corrosion rate, however, did occur once the SO2 concentration increased to 4,500 ppm and 40,000 ppm of O2 was added to the system.
To obtain the corrosion rates, weight-loss methods were used after 48 h of exposure. The specimens were removed, cleaned, rinsed, dried, and weighed.
Figure 2 shows the samples after the corrosion tests in the supercritical CO2 phase (with 650 ppm H2O and 100 ppm NO at 80 bar and 35 °C) with different SO2 and O2 concentrations. Figure 2(a) shows Test 1: 50 ppm SO2, where most of the surface was shiny with no visible signs of corrosion. Figure 2(b) shows Test 2: 4,500 ppm SO2, where the formation of scattered corrosion products on the surface of steel. Figure 2(c) shows Test 3: 50 ppm SO2 + 40,000 ppm O2 and Figure 2(d) shows Test 4: 4,500 ppm SO2 + 40,000 ppm O2. In these tests, when in the presence of O2, the entire surfaces were covered by dark reddish corrosion products.

Scanning electron microscopy (SEM) and energy dispersive spectroscopy (EDS) were used to determine the surface morphology and the composition of the corrosion product layers. Corrosion products were removed, and the localized corrosion was measured.
Figure 3 is a SEM image of the surface of one specimen after 48 h of exposure in the supercritical CO2 phase (with 650 ppm H2O; 4,500 ppm SO2; and 100 ppm NO). Evident on the surface was corrosion products with cracks. Figure 4 is also a SEM image of the surface of one specimen after 48 h exposure in the supercritical CO2 phase (with 650 ppm H2O; 4,500 ppm SO2; 100 ppm NO; and 40,000 ppm O2). The surface was clearly covered by thick corrosion products. The scientists performed EDS analysis of the corrosion products and determined that, although the morphology of the corrosion product is different, the constituent elements are the same (Fe, O, and S). They note that this signifies the formation of ferrous sulfate (FeSO4) or ferric oxide (Fe2O3).

Figure 5 shows the surface morphologies of the specimens once the corrosion products were removed. No localized corrosion was observed in any of the different conditions. Figure 5(a) is from Test 2: 4,500 ppm SO2. Figure 5(b) is from Test 3: 50 ppm SO2 + 40,000 ppm O2. Figure 5(c) is from Test 4: 4,500 ppm SO2 + 40,000 ppm O2.
Corrosion of CS is considerably accelerated in the presence of flow and localized corrosion was observed in the presence of both O2 and flow. This is illustrated in Figure 6 in which the corrosion rates of CS (in the flowing supercritical CO2 phase) are compared with different O2 concentrations. The corrosion rate changed from 0.16 mm/y without flow to 1.30 mm/y in the presence of flow. The researchers note that though adding 20,000 ppm O2 does not affect the general corrosion rate under flowing condition, it significantly increased when 40,000 ppm O2 was added.

In the absence of O2 during the flowing supercritical CO2 phase, black corrosion products formed on the surface (as opposed to the red products seen in the presence of O2). Figure 7 shows pictures of the specimens after corrosion tests with 650 ppm H2O; 4,500 ppm SO2; and 100 ppm NO at 80 bar CO2 and 35 °C with 1,000 rpm of flow. Figure 7(a) is from Test 5: 0 ppm O2. Figure 7(b) is from Test 6: 20,000 ppm O2. Figure(c) is from Test 7: 40,000 ppm O2.
The researchers also performed high-resolution optical profilometry analysis of several pits observed on the cleaned samples exposed to the flowing supercritical CO2 phase (with 650 ppm H2O; 4,500 ppm SO2; 100 ppm NO; and 20,000 ppm O2 for 48 h). Figure 8 shows that, although the presence of flow increased general corrosion rate, no localized corrosion was observed on the surface in the absence of O2.
The researchers stress that additional studies are required to examine the relationship of the impurities and flow with localized corrosion.

Reference
1 M. Colahan, Y.S. Choi, S. Nesic, “Effect of Flow on the Corrosion Behavior of Pipeline Steels Under Supercritical CO2 Environments with Impurities,” CORROSION 2021, paper no. 16656 (Houston, TX: NACE International, 2021).
(Figure 6, Figure 7, and Figure 8 are available here.)