Corrosion of materials is the most common and most important failure mechanism in industry, from infrastructure and transportation to production and manufacturing. According to a breakthrough two-year study entitled “Corrosion Costs and Preventive Strategies in the United States”1 released by NACE International and the U.S. Federal Highway Administration, the total annual estimated direct cost of corrosion in the United States is a staggering $276 billion, which is ~3.1% of the nation’s gross domestic product (GDP). Corrosion inspection and monitoring play a critical role in implementing optimal corrosion-control practices to improve lifecycle and asset management.
Corrosion occurs when oxide(s) or salt(s) grow on the metal surface as the metals are exposed to moisture in the air. Corrosion can take place either locally to form a pit or crack, or it can extend uniformly across a wide surface. Proper surface analysis of the corroded sample provides insight into the corrosion characteristics and mechanisms so the best material, protective coatings, and corrosion-control measures for targeted applications can be selected.
Unlike other techniques, such as touch probes, the Nanovea 3D Non-Contact Profilometer† uses the chromatic confocal technique to measure surface features without touching the sample. This avoids the risk of removing important loose corrosion products, and it allows preservation of the true surface features. It has zero influence from sample reflectivity or absorption and requires no sample preparation. The combination of high surface angle acquisition and large Z measurement ranges makes the chromatic confocal technique an ideal tool for measuring corroded samples, which often contain complex surface texture and deep pits. The portable model enables corrosion inspection on site.
In this application, the profilometer was used to examine the surface morphology (i.e., erosion corrosion and pitting corrosion) of two samples after service in a corrosive environment. Surface roughness, materials loss, and pits statistics on the sample surface were calculated to provide further analysis for studying the corrosion mechanism.
Results and Discussion
Sample A after Corrosion and Erosion Attack
The three-dimensional (3D) view of the sample after corrosion attack provided a straightforward tool to directly observe the morphology of the surface from different angles. Figure1 shows that Sample A had been severely attack by corrosion and erosion at the edge.
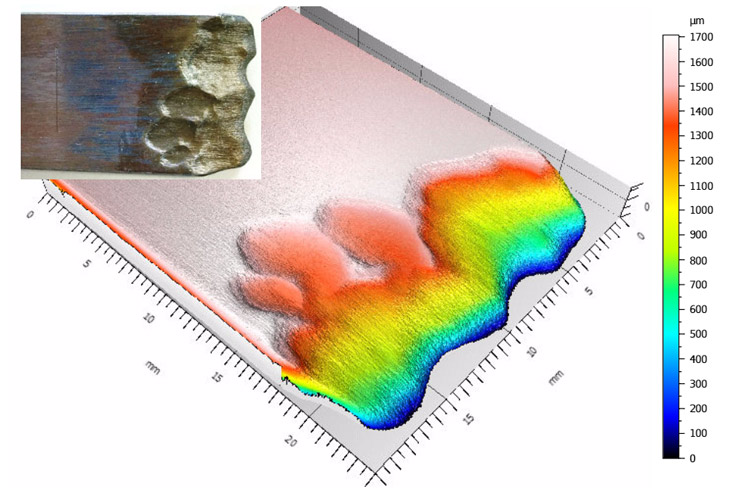
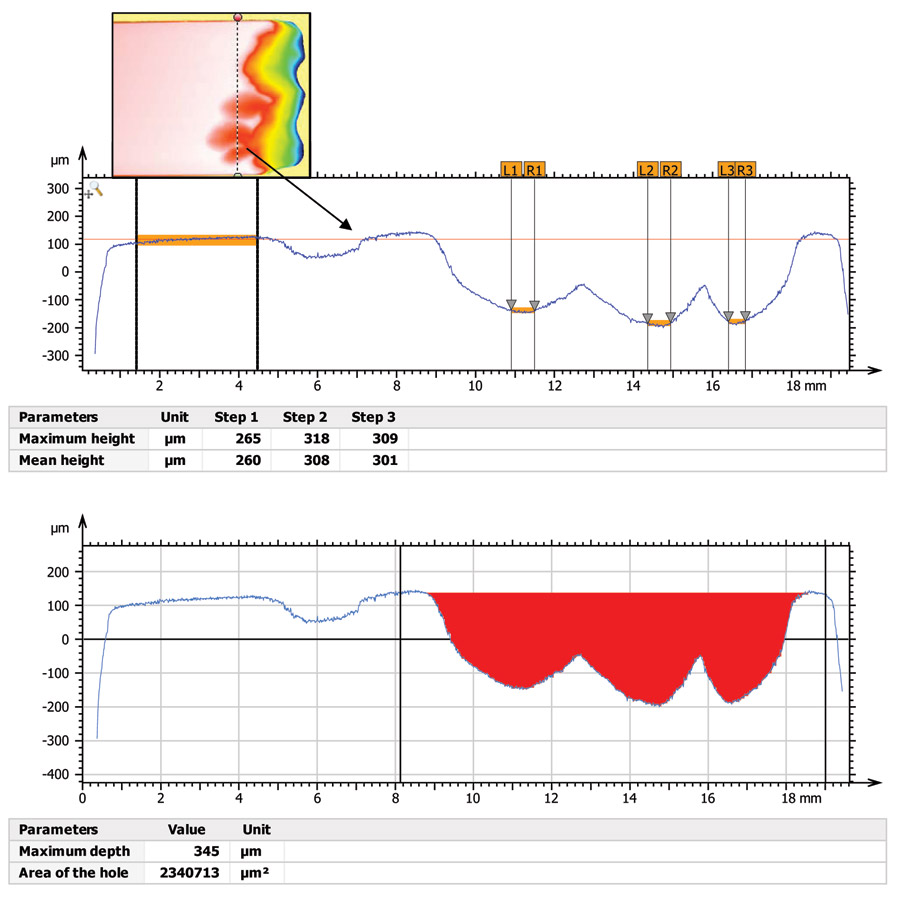
Figure 2 shows an example of a two dimensional (2D) profile analysis on the valleys created during the corrosion and erosion attack. The three adjacent valleys possess depths of 265, 318, and 309 µm, respectively, and the total area of the hole is ~2.3 mm2. A 2D profile analysis is helpful in providing a more precise measurement of the sample’s shape.
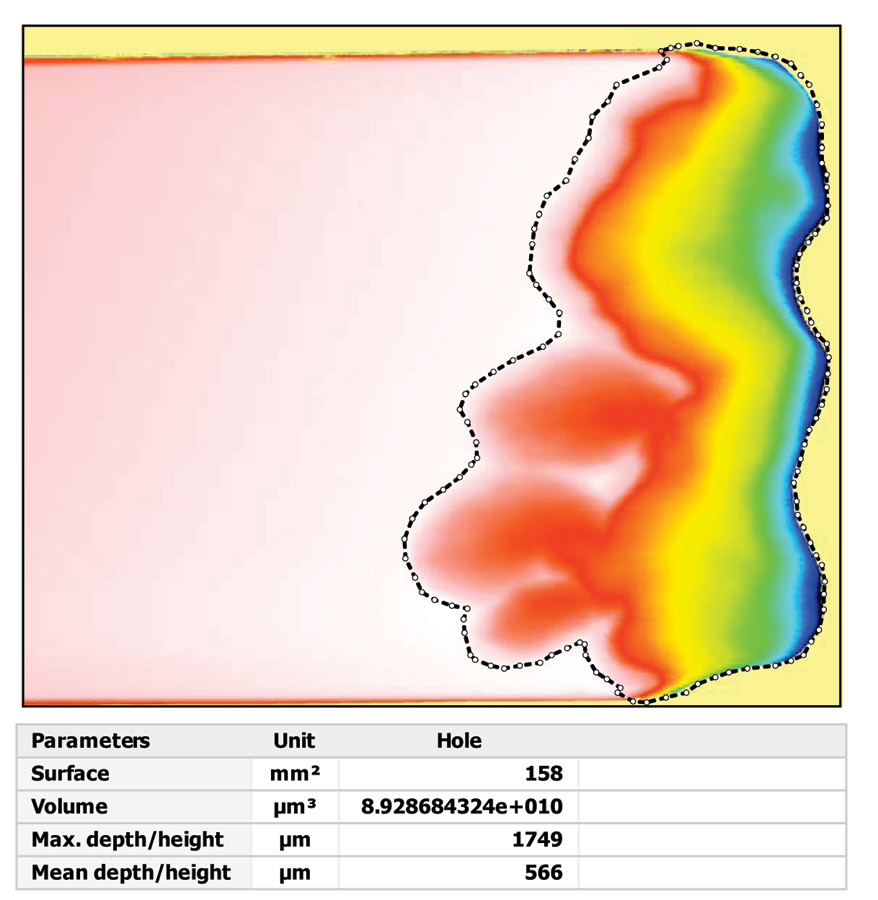
The volume loss of Sample A is analyzed in Figure 3, where the severely attacked area was selected and measured. The total material volume loss in the selected area is 89 mm3 as calculated by the software. This information is important for selecting the best material candidate with the lowest corrosion rate.
Sample B after Pitting Corrosion
Pitting corrosion is a localized form of corrosion that leads to the generation of cavities in the material. Pitting is more difficult to detect, predict, and design against, and thus more dangerous than uniform corrosion damage. Therefore, a reliable tool for pitting detection and analysis is critical for preventing catastrophic failures that pitting may provoke.
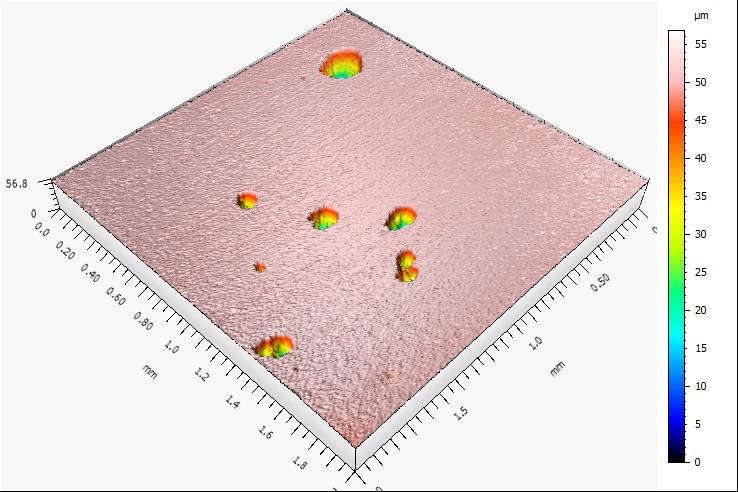
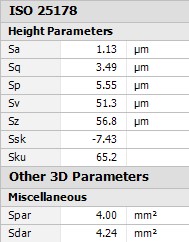
Figure 4 shows the 3D view for Sample B after pitting corrosion attack. Eight pits of different sizes are distributed on the measured surface, while the other areas remain intact, reflecting the extremely localized nature of pitting corrosion. The roughness of Sample B is summarized in Figure 5.
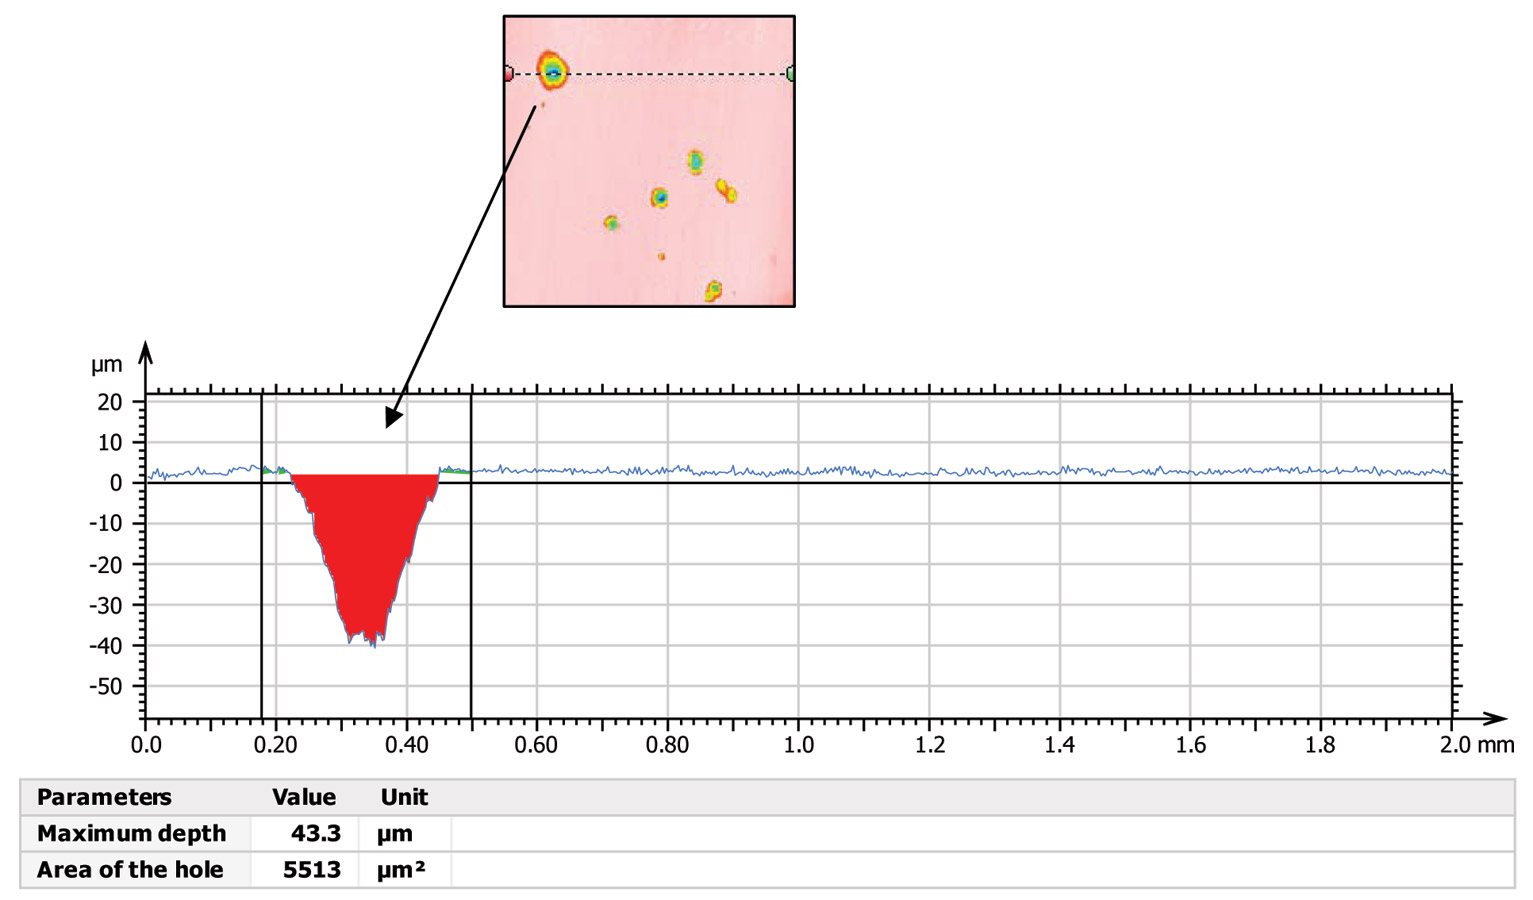
Pitting can be initiated by several factors, such as localized chemical or mechanical damage to the protective oxide film or the protective coating, as well as the presence of non-uniformities in the metal structure.2 Figure 6 exhibits the 2D profile analysis for one of the pits. The measured pit has a “cone” shape with a maximum depth of 43 µm and area of 5,513 µm2. Because of the high surface angle acquisition and large Z measurement ranges of the chromatic confocal technique, the shape and morphology of the deep pits can be precisely determined. Such information is important in analyzing the corrosion mechanism and development stage of pitting.
Figures 7 and 8 analyze the individual and overall pits on the sample surface, respectively. Figure 7 shows the depth, size, volume and diameter values of each pit, while Figure 8 lists the statistics of the overall pits on the scanned surface. The sample surface has eight pits with volumes ranging from 6,528 to 605,311 µm3. The pits occupy 2.63% of the total sample surface, and the density of the pits is 2.0 pits/mm2. Such in-depth statistics of the pits enable users to precisely assess the severity of the pitting corrosion of the sample, so an informed decision can be made in the implementation of optimal corrosion control practices.


Conclusion
In this application, a non-contact 3D profilometer using the chromatic confocal technique was used for evaluating different forms of corrosion, including erosion corrosion and pitting corrosion. The chromatic confocal technique allowed the corroded surface to be measured without touching it, which preserved all the details of the surface features. It has a large Z measurement range and no influence from sample reflectivity, which allows precise determination of the shape of deep corrosion pits and the complex texture of corroded surfaces. The analysis software provides measurements such as roughness and volume loss, as well as pit distribution, depth, size, and volume, which facilitate investigation of the corrosion characteristics and mechanisms. Sample A after erosion corrosion attack had a volume loss of ~89 mm3. Sample B after pitting corrosion showed eight pits of different volumes, ranging from 6,528 to 605,311 µm3. The pits occupied 2.63% of the total sample surface, which had a pitting density of 2.0 pits/mm2.
The data shown here represent only a portion of the calculations available in the analysis software. Profilometers measure virtually any surface in industries that include semiconductors, microelectronics, solar, fiber optics, automotive, aerospace, metallurgy, machining, coatings, pharmaceutical, biomedical, environmental, and many others.
†Trade name.
References
1 G.H. Koch, et al., “Corrosion Costs and Preventive Strategies in the United States,” Federal Highway Administration, FHWA-RD-01-156, March 2002.
2 “Pitting Corrosion,” NACE International, http://www.nace.org/Pitting-Corrosion (September 28, 2015).
DUANJIE LI is the lead materials scientist at Nanovea, 6 Morgan, Ste. 156, Irvine CA 92618, email: duanjie@nanovea.com. He has a B.S. degree from Tsinghua University in China and a Ph.D. from McGill University in Montreal, Québec, Canada. He specializes in advanced mechanical, tribological, and surface profile characterization techniques. He develops novel functions and algorithms to improve accuracy and versatility of the precision materials characterization instruments.