This article concerns the accurate estimation of dry film thickness (DFT) of individual coats or of the overall thickness of a painting system using image processing software. DFT influences not only the technical performance and durability of coating systems but also its costs, and it may also have a big impact in cases of paint failures.
Performance of a painting system depends on paint types, the number of coats applied, and dry film thickness (DFT) of each coat. The first step is related to the correct selection/specification of the coating system. In this respect, there are either international standards such as ISO 12944-5, ISO 12944-6, national standards such as SSPC standards, or other normative standards such as Norsok M501.
If paint thickness is either too low or too high, painting system performance is, in most cases, affected or reduced. This may lead to losses and claims that require significant amounts of money. In the worst-case scenario, it can even lead to disasters.
Improper DFT is associated with both application and inspection. To measure the total DFT of a painting system is easy, but it is more difficult to measure the DFT of one of the previous layers. Sometimes it is necessary to measure the DFT of one specific coat.
For example, the thickness of a zinc-rich epoxy primer is essential for a good performance in marine or offshore environments. For painting inspectors, the device that allows us to measure DFT is the Tooke† Gage. Many published articles discuss the importance of meeting the DFT.1-4
Common Practice

A
Tooke Gage
is a destructive testing tool used to determine the overall thickness, or the individual layer thickness, of a dry paint or coating in accordance with ASTM D4138. The product works by making a small incision, about the width of a pencil, through the coating down to the substrate level. The V-shaped groove is then observed through a microscope, where an adjustable scale is used to measure the thicknesses of the coating layers.5
On the market, several companies produce Tooke Gage products, and it is assumed that the reader knows how to use them. This study involved the use of a TQC Super PIG III†.6
In order to determine the coating thickness on the graduation scale, measure and multiply with the D factor of the cutter, depending on the "µm" or "mil" scale. The D factor depends on the cutter number/cutter angle, as Table 1 shows.6
One can measure the DFT either by eye, counting the number of divisions, or by taking a photo and then counting the divisions to determine the DFT (see Figure 1, top).
A third way would be to use an image-processing software to analyze the photo and get more accurate and less laborious results.

New Procedure
One open-source software is ImageJ, a Java-based image processing program developed at the National Institutes of Health (NIH) and the Laboratory for Optical and Computational Instrumentation (LOCI, University of Wisconsin).7
ImageJ is used for processing and analyzing scientific images not only for medicine but also for metallography and for other domains as well. ImageJ is available for Windows, Mac OS, and Linux in several distributions: ImageJ, ImageJ2, and FIJI (see https://imagej.net).

ImageJ allows us to determine the DFT by following these steps:
- Open the photo in FIJI.
- Go to “Analyze” menu, then select “Tools,” then “ROI Manager,” where ROI stands for region of interest.
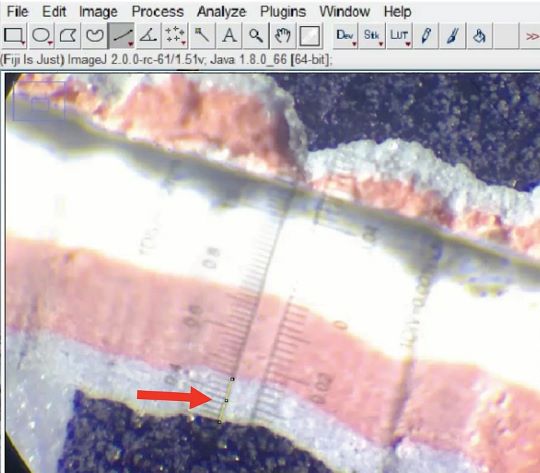
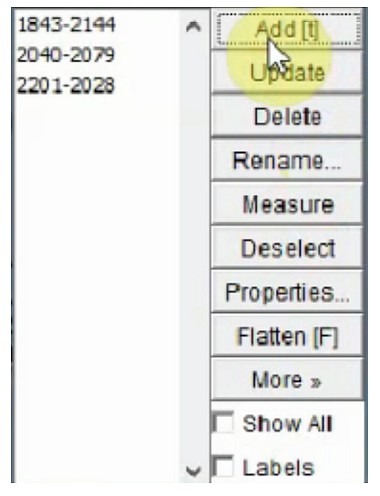
- On the proper scale (either “mils” or “microns”), draw lines for each coat (see Figure 2) then press the “Add” button on ROI manager in order to add it to the list. (See Figure 3).
- Select each of the three lines and customize it using the “Rename” and “Labels” command buttons from the ROI menu.
- Draw a line over one single division and then set the scale from the “Analyze” menu, “Set scale” command. In the “Known Distance” text box, introduce the coefficient from the manual, function of knife number (in this case, 10 microns).
- In order to get the scale bar, draw a line in the lower right corner (for example) then, from the “Analyze” menu, select the “Tools” submenu and “Scale Bar ” command . In “Width in Mic” text box, one may use a more practical length such as 100 microns.
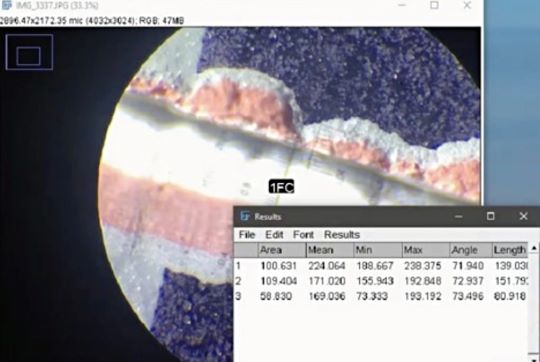
- In order to get the DFT of each coat, select all three coats on ROI, then press the “Measure” button and one table with results will be displayed. The “Length” represents the DFT in microns (see Figure 4).
- A screen clip may be inserted in the report.
Discussion
Measuring DFT using the Tooke Gage can be not only simplified but also made more precise and faster by using image processing software.
The precision of the software is greater than the perception of the human eye. The results are presented in a transparent way, and the measurement can be reproduced at any time by a third party. Note that it is important to keep the camera sensor parallel with the microscope lenses and with the probe.

This type of software may have other uses as well, as Figure 5 shows. Area estimations are based on photos — one should bear in mind that there is room for error in case of sloped surfaces and/or lack of parallelism between the camera and the surface being assessed.
Broadly speaking, the use of image processing software can be summarized in a few steps:
- Take the photo, ensuring that the area to be assessed is parallel with the camera sensor;
- Download the photo to the computer and use an image editing software (eventually a graphic tablet with a stylus) for marking the regions of interest;
- Import the photo/open the photo in image processing software and measure the desired parameters: lengths, areas, count some elements, etc.
Conclusions
The use of image-processing software can increase precision, eliminate subjectivity, and/or reduce “noise.”8
The use of image-processing software should be agreed to among all parties, and its use should be based on a written procedure that eventually can be included in the painting specification.
Perhaps in the near future, manufacturers will include such software in the kit. Using the same procedure may help to establish a common ground and avoid conflicts.
† Trade name.
Editor’s note: This article first appeared in the October 2024 print issue of Materials Performance (MP) Magazine. Reprinted with permission.