Early signs of coating degradation were investigated by impedance measurements at 40 locations on a docked, jacketed offshore platform 1.5 and 2 years after full coating renewal. The platform coatings were evaluated in comparison to 38 reference samples with partial and complete coating systems that were aged at the shoreline for 1.5 years and subsequently tested in the laboratory in dry and wet states.
The quantitative coating quality approach based on log Z measurements at 0.1 Hz and subsequent statistical analysis has provided means to quantitatively assess coating degradation in situ and identify a platform site with limited coating durability.
Recent advances in the field application of electrochemical impedance spectroscopy (EIS) demonstrate its usefulness for quantitative assessment of coating condition prior to the occurrence of visible damage and establish EIS as a tool for predictive coating maintenance.1
Here, we present a quantitative coating quality (QCQ) assessment approach that addresses the following challenges of field application of EIS to coatings:
- Simplicity of application
- Applicability to surfaces of any orientation and curved surfaces
- Alternating current (AC) interferences, relative humidity (RH), and temperature impact
- Assuring quality of results
- Coating assessment criteria
QCQ can include measurements of corrosion potential, impedance spectrum, and impedance at a single frequency of 0.1 Hz, as well as Bode and tan δ graphical analysis.2 In the present study, the QCQ in its simplest form, by log Z at 0.1 Hz measurements and an evaluation criterion,3 was used to evaluate the protective effect of coatings in offshore applications.
Equipment
Impedance measurements were performed using a device2,4-5 developed at the Faculty of Chemical Engineering and Technology at the University of Zagreb. It consists of an impedance instrument, flexible conductive polymer electrodes, and a conductive paste electrolyte (see Figure 1).
The measurement procedure is compliant with EN ISO 16773-26 but uses the alternative measurement cell. In the two-electrode measurement setup (used on the platform), a pair of electrodes connected to the instrument is placed on the coating surface so that no contact with the substrate is required. In the single electrode measurement setup (used in the laboratory), one electrode connected to the instrument is placed on the coating surface and the other
instrument lead is connected to an exposed portion of the substrate.
The electrodes with dimensions of 4 by 6 cm easily adhere to the flat coating surfaces of any orientation or slightly curved surfaces with the help of a thin layer of adhesive electrolyte paste (Rel < 250 Ω). The alternative cell provides a coating impedance unaffected by liquid electrolyte reflecting the current coating state in a given environment. To increase the sensitivity of the method to coating degradation, a wetting solution can be used to rapidly hydrate the coating prior to measurement.
The measurement results for the impedance in ohms were multiplied by the electrode area equal to 24 cm2 and for the two-electrode arrangement, and additionally by one half to account for the fact that the current f lows twice through the coating.
The frequency of 0.1 Hz was chosen as a compromise between the speed of the measurement and the ability to detect the onset of resistive behavior of the coating due to coating degradation as opposed to the ideal capacitive behavior of the intact coatings. The measurements, performed in quintuplicate, take ~2.5 min per set. In the remainder of the text, log Z refers to the average of five measurements of log Z at 0.1 Hz, expressed in Ω·cm2. The simple and fast measurement procedure allows testing at multiple points and/or repeated or replicated tests to ensure the quality of the results.
To determine accuracy and precision, calibration foils7-8 (100- to 250-µm thick commercial polyester films) and a high-impedance dummy cell constructed according to EN ISO 16773-3 were employed to mimic intact coatings or coatings in the early stages of degradation. Statistical analysis and coating assessment are done after logarithmic transformation of the impedance modulus. The logarithmic scale is more suitable for comparing large numbers and is justified in the present case, since the coating performance is considered to change when the impedance changes by an order of magnitude.7
The AC interferences start to influence the measurements by more than 1% for coatings with log Z >10.4. AC influence can be mitigated by increasing the signal amplitude9 up to its maximum value of 250 mV. The ReCorrQCQ† software outputs both the sinusoidal interference signal and the intensity spectrum that enabled AC interference management by selecting the measurement location and/or optimizing the signal-to-noise ratio.
For coatings with log Z=11, an interference amplitude of up to 250 mV and a positive signal-to-noise ratio, the relative root mean square (RMS) of log Z can be kept below 1% and the maximum relative error in log Z can be kept below 5%. In the Faraday cage, the relative RMS of log Z is less than 0.1% and the maximum relative error is equal to 0.64%.
Reference Samples and Test Locations
The coating systems used on the platform and the reference samples had self-priming epoxy, zinc-rich, or zinc-phosphate epoxy primers as base coats; epoxy or epoxy mastic intermediate coats; and epoxy, epoxy mastic, or polyurethane topcoats. Total dry film thicknesses (DFTs) of 225 to 430 µm were specified, achieved in two to four layers. All measurements were performed without knowledge of the coating system details.
The 31 platform locations tested were at the following sites: decks, helideck, jacking house exterior, bracing, stairs, decanter space, cellar deck, handrails, anchor winch, piping, and at one of the preload tanks.
During paint system renewal, 38 reference samples were prepared with partial and complete coating systems and aged at the shoreline, a few meters from the sea, for 1.5 years. After transfer from the exposure site, the reference samples were stored for at least three months under laboratory conditions (23±2 °C and ≥50% RH) to allow them to dry. Impedance was measured on the aged dry samples and on the aged samples after one and two weeks of exposure to 100% RH. It was found that further exposure to 100% RH caused no change in impedance.
Measurements on Reference Samples
The typical appearance of the reference samples with partial and complete coating systems after 1.5 years of exposure at the shoreline is shown in Figure 2 (top). All primers with thicknesses close to 100 µm show pronounced corrosion damage. Two-layer samples of thicknesses close to 250 µm showed several corrosion spots on the coating surface, while the three- and four-layer coatings with a thickness of ~350 and 450 µm showed no visible corrosion damage. All the samples show discoloration near edges that were not stripe coated.
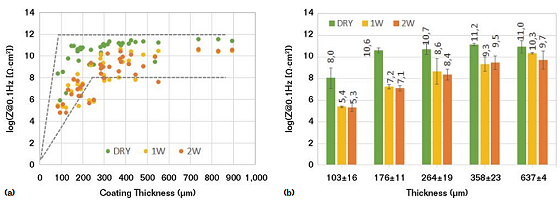
Figure 3(a) shows all the measured data. Log Z of the coating systems thicker than 300 µm does not fall below 8, while almost all thinner coatings show values below 8, some even below 5. In general, defects become apparent in coatings with log Z <6. Further analysis showed that regardless of the system type or the number of layers, coatings with similar thickness had similar impedance values. Therefore, the log Z values were averaged over 100 µm thickness ranges and the results are shown in Figure 3(b). The impedances of single layer coatings (primers) with an average thickness of 103±16 µm were averaged separately and shown in Figure 3.
Table 3 of EN ISO 12944-910 requires minimum DFT values of 280 µm in an atmospheric CX offshore zone and 450 µm in CX tidal and splash zones for Sa 2½11 blasted carbon steel with zinc-rich primer. Considering the impedances of the reference samples in Figure 3(b), it was concluded that the complete coating systems with log Z ≥8.5 in the atmospheric CX zone and with log Z ≥9.5 in the tidal and splash zone can be considered as well performing.
Samples with log Z <8.5 can be classified as underperforming. Underperforming systems with log Z <7 may be classified as doubtful and warrant an increase in the number of test points and measurements of the full impedance spectrum. These criteria apply to offshore-grade coating systems under marine atmospheric exposure.
Measurements on the Platform
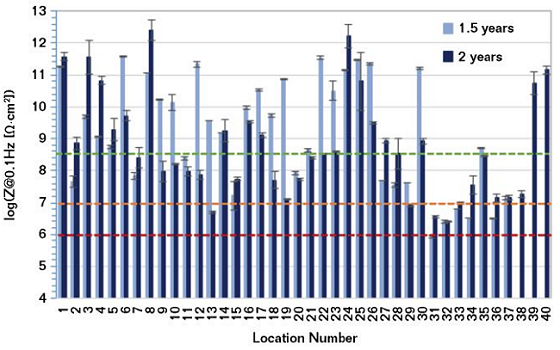
Figure 4 shows the log Z measured at different locations on the platform 1.5 and 2 years after renewal. The average relative logarithmic RMS was 0.72 and 1.78% for the first and second measurement runs, respectively, indicating high measurement precision.
The differences in the two measurement runs were: 1) the weather conditions before and during the measurements, and 2) that the measurements in the first and second sets were made at identical sites but not the same locations.
During the first and second measurement run, the respective average air temperatures were 15.1±3.1 °C and 8.7±1.9 °C. The respective air RHs were 42.1±12.5% and 42.4±14.4%. Log Z values ranging from 6 to 12 were measured under the above RH conditions. The temperature difference did not seem to play a decisive role, so the two independent field experiments yielded similar conclusions.
Of the 31 measurement locations (no. 1 to 31) tested in the first run, 21 were found to be well performing. Nine underperforming locations had log Z >7 and only one underperforming location (no. 31), found in a preload tank, had a log Z ≈6 and was classified as doubtful. After a further six measurements were taken in the same tank (no. 32-37), one location was classified as well performing (no. 35), one as underperforming (no. 37), and four as doubtful (no. 32, 33, 34, and 36).
The conclusions after the second run may be summarized as follows. Of 31 measurement locations from the first run, 15 locations were found well performing in both runs. Four locations were found underperforming in both runs. Five locations shifted between well performing and underperforming in each direction. Tank location no. 31 remained doubtful in the second run. Another doubtful location was found on the deck of the jacking system (no. 13), but the site was not investigated further.
At an additional six tank locations, the three previously doubtful locations were found to be underperforming. One additional location measured inside the tank in the second run was found underperforming (no. 38) and the two additional locations measured at sites other than the tank have shown to be well performing (no. 39 and 40).
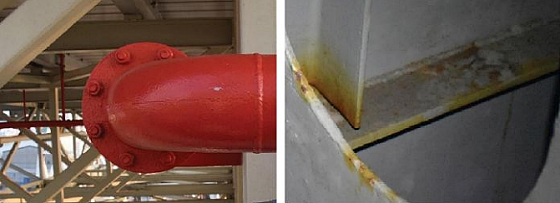
Figure 5 shows the typical appearance of the log Z ≥7 coatings (left) and the doubtful coating within the tank (right) after two years of atmospheric exposure. It has been discussed previously that low impedance coatings are more likely to exhibit visible early degradation at edges and welds.2 Subsequent analysis of the coating specifications revealed that the tanks were the only site where a two-layer self-priming epoxy coating system of 2 by 150 µm, without a need for stripe coating, had been specified and applied.
Conclusions
The investigated QCQ approach proved to be applicable to offshore-grade coatings in early stages of coating degradation. Rapid measurements can be repeated and performed in multiple locations to ensure quality of results. The high field measurement precision indicates that the AC interferences were successfully managed by the EIS signal amplitude optimization.
Similar conclusions from the two independent runs unequivocally indicated the preload tank as a location of limited coating durability. The rationale for this observation was later found in the specification of the tank coating system. Laboratory and field QCQ testing based on EIS and subsequent statistical analysis have shown the potential to serve as a valuable tool for predictive coating maintenance.
† Trade name.