When major pipeline projects planned for the United States and Canada became delayed, the pipe produced for these projects spent years stockpiled in outdoor storage yards. The epoxy coatings on the exterior of the pipes was designed for underground service and not intended for extended outdoor weathering exposure where the coating can degrade.
Induced polymer degradation caused by the photooxidation of the epoxy polymer from ultraviolet (UV) light due to the sun is a well-documented phenomenon. The energy of the UV photons is sufficient to break the polymer chain backbones, resulting in diminished physical and chemical properties of the polymer.1 Recently oil and gas companies, public interest groups, and state and federal regulatory agencies have investigated the potential performance and environmental impacts of degradation of coatings on pipelines subjected to extended periods of weathering.2
A field study of pipeline fusion-bonded epoxy (FBE) coating was conducted to better understand the time course of chalking and subsequent loss of dry film thickness (DFT). While field studies produce useful data on in-service performance, they are labor intensive and subject to production schedules and inherent environmental variability. As a result, a laboratory study was conducted to develop a quantitative method for determining the degree of chalking during accelerated weathering and compare the chalking between accelerated weathering and service exposures. Testing also included evaluation of the chalk compositions.
Field Study
KTA-Tator (Pittsburgh, Pennsylvania, USA) has been assisting in a largescale field study that consists of semiannual field visits to measure physical coating characteristics on select test pipe joints exposed to UV light (sunlight) and weathering over the past several years. This study is being conducted at multiple pipe storage sites in Mid-Atlantic states of the United States.
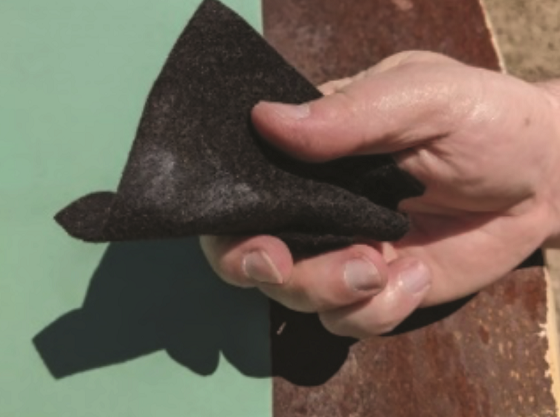
Representative samples of exterior pipe sections on the tops of the stacks were selected to undergo both nondestructive and destructive testing to determine the impact of sustained exposure to their environment, as shown in Figure 1. The level of chalking was determined in accordance with ASTM D4214,3 as demonstrated in Figure 2. Adhesion of the FBE to the pipe was measured by the knife test in accordance with ASTM D6677,4 which consists of utilizing a knife to evaluate the bonding characteristics of the FBE.

The thickness of the coating system was also measured over this time period in accordance with ASTM D7091,5 using a Type II, nondestructive magnetic DFT gauge. To verify the thickness readings at the six-month intervals, destructive testing in accordance with ASTM D41386 was also employed using a Tooke gauge. The Tooke gauge utilizes a precision cutting tip, which allows the cross section to be viewed via microscope to determine the coating thickness.
The field study revealed that, over a period of several years, the chalk ratings varied from moderate to little chalking. Experience based on previous examinations of conventional epoxy coating systems indicate that once a chalk film forms on the surface, the chalk itself minimizes the progression of additional chalking. Weathering environments can affect and deteriorate the chalk film. Despite the temporary protection of the chalk, it can be washed away by condensation or rain.
During the field evaluations, adhesion of the FBE to the pipe was consistently rated as 10 (good). The type II, non-magnetic field gauges indicated an average DFT loss of 16 µm/y, which was slightly >13 µm DFT loss measured in accordance with ASTM D4138. Due to the expected variance of the two methods, these differences were considered insignificant.
Laboratory Investigation
The laboratory investigation consisted of exposing steel pipe sections coated with a light green-colored FBE coating to controlled accelerated weathering conditions for 1,500 h and testing for the degree of chalking, weight, and coating thickness of the coating after every 500 h of exposure. The sample preparation procedures, test methods employed, and test results are summarized in the following section but have previously been described in detail.7
Sample Preparation
The FBE-coated samples (~15 by 10 cm) were cut from a section of 0.8-cm thick FBE-coated steel pipe obtained from the field. These pipes were from another project than the field study project. The coated surface of the FBE test samples were gently wiped with a soft, wet cotton cloth to clean off any residual dust and dirt. The edges and back surfaces of the panels were protected with adhesive tape.
Accelerated Weathering Exposure
Three of the FBE-coated samples were exposed to 1,500 h of ultraviolet light in an accelerated weathering cabinet targeting 0.89 W/m2 UV-A irradiance centered at 340 nm and set for a temperature of 60 °C. Another three samples were exposed to cyclic UV/condensation: repetitive cycles of 4 h of ultraviolet light exposure targeting 0.89 W/m2 UV-A irradiance centered at 340 nm, and set for a temperature of 60 °C, followed by 4 h of condensation exposure set for a temperature of 50 °C. The samples were removed from each exposure condition and tested for chalking, weight change, and DFT after ~500, 1,000, and 1,500 h of total exposure. After the initial 1,500 h, the panel surfaces were wiped clean and re-exposed to cyclic UV/condensation for another uninterrupted 1,500 h to verify the results of the wiping from the initial exposure.
DFT Changes After Exposure
The DFT of each sample was initially measured at six different locations (top left, top right, mid left, mid right, low left, and low right) in accordance with ASTM D7091 using a Type 2 electronic magnetic probe.5
After 500 h of accelerated weathering exposure, the DFT was measured at two spots—top left and top right. After 1,000 h of exposure, it was again measured in two spots—low left and low right. Finally, after 1,500 h of exposure, the DFT was measured in two spots—mid left and mid right. The average and range of the initial DFT measurements compared to those after each of the exposure intervals are presented in Figure 3. When the variability of the measurements is considered, no definitive trends in the change of the DFT after exposure were observed.

Weight Change After Exposure
The samples were weighed before exposure and after each exposure interval to determine if any of the samples lost or gained weight during exposure. The samples were weighed on a digital scale with a maximum capacity of 32 kg and a resolution of 1 g. There was one gram of weight loss observed on one sample after 1,500 h of UV/condensation exposure. This could be considered normal experimental variation and is not considered as a significant result based on the accuracy of the scale.
Surface Wiping with Laboratory Wipes
After each exposure interval, one of 5 by 10 cm sections designated as high, mid, and bottom on each panel was gently wiped with a folded laboratory wipe. The folded wipe was weighed before and after wiping on a digital analytical balance (with a capacity of 220 g and a resolution of 0.1 mg). A different section of the surface of each sample was wiped after each exposure interval.
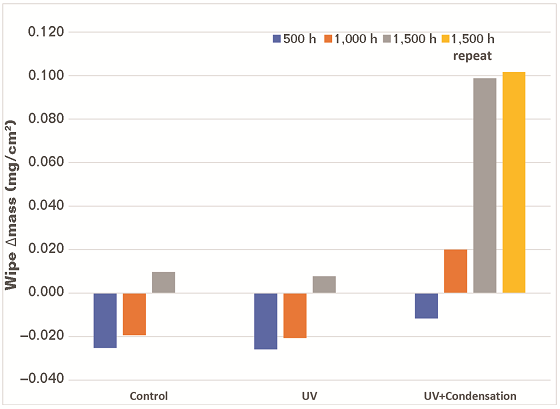
The data on the change in weight of the wipes are presented in Figure 3. The wipes were found to lose mass during the 500-h evaluation, which likely indicates that the wipe was being abraded by the coatings. Mass gain was observed during the 1,000- and 1,500-h UV/condensation exposure evaluations. The mass of the coating removed was significantly greater for the samples exposed to UV and condensation compared to the samples that were only exposed to UV. This indicates that the presence of moisture is involved in chalking. The results of the repetition of the 1,500-h UV/condensation exposure were consistent with the initial 1,500-h exposure.
Infrared Analysis of the Residue
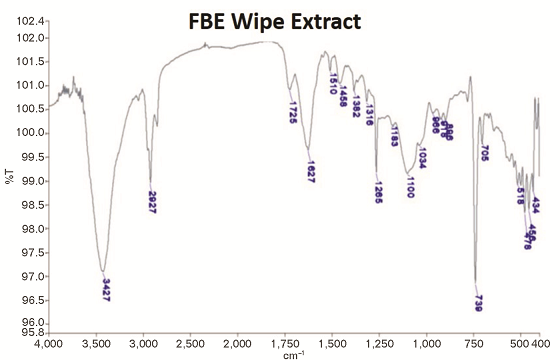
The residue collected on the laboratory wipes after 1,500 h UV/condensation exposure was analyzed by infrared (IR) spectroscopy. The residue was extracted with methylene chloride (CH2Cl2). The extracted solution was allowed to dry. Potassium bromide (KBr) powder was then added to the solvent residue that included the removed residue and ground to a fine powder. The powder was then pressed into a pellet for analysis.
The IR analysis revealed that there was epoxy residue in the chalk removed from the samples (Figure 4). The intensities of the epoxy bands were in the range of 0.5 to 2% of the transmission scale, which indicates it was present in a low quantity. Crystalline silica was observed as evidenced by the band near 1,100 cm–1 along with the epoxy resin.

Discussion
The field study of pipe stored for several years in the U.S. mid-Atlantic found an average DFT loss of roughly 15 µm/y. This is consistent with results of field studies of pipe stored for seven to nine years in Alberta, Canada and Arkansas, United States published in two recent papers by researchers from TC Energy.8-9 They reported essentially no DFT loss for the pipe stored in Alberta, while the pipes stored in Arkansas showed DFT losses of 25 µm/y.
The mass of chalk removed by the wipes from the laboratory FBE samples exposed to 1,500 h of cyclic UV and condensation was ~0.1 mg/cm2, which is equivalent to 4 µm/y assuming a FBE density of 1.4 g/cm3. But further examination of the 500- and 1,000-h results suggest that calculation of average loss is misleading because the rate of DFT loss does not appear to be linear. Furthermore, the amount of chalk removed by the wipe is not a direct measurement of DFT loss because some fraction of the coating could have chalked and been washed away during the condensation cycle during exposure.
The chalk mass removed by the wipe was much greater for the exposure that combined the UV and condensation cycles compared to the UV exposure alone. The role of the condensation evidently extends beyond washing the chalk from the surface because the results reflect the chalking that remained on the surface.
The presence of the epoxy resin in the chalk from the lab wipe is not understood. It is not believed to be due to abrasive action of the wipe because the results of the 500-h exposure showed that it was the wipe that was being abraded, not the FBE. It could be that the UV exposure is breaking down the bonds to the extent that the epoxy functional groups are still recognizable.
Acknowledgments
The authors would like to thank Joe Barush, Rob Lanterman, and Valerie Sherbondy for their work in generating the data and review of the final documentation.
References and About the Authors