The 7000 series aluminum alloy, with high strength, good welding performance, and excellent corrosion resistance, has been widely used in the aerospace industry, vehicles, buildings, large pressure vessels, etc.1-2 However, those alloys are prone to electrochemical corrosion in corrosive environments under the interaction of the mechanical environment, which limits their broader application.3-4
Although the electrochemical corrosion of Al-Zn-Mg-Cu alloys in a near-neutral 3.5 wt% sodium chloride (NaCl) solution has been studied over the past several years,5-7 researchers have seldom considered the effect of current density (CD) on the electrochemical corrosion of the micro-arc oxidation (MAO) coating of 7050 aluminum alloy (AA7050) (UNS A97050).
Therefore, in this article, the effect of CD on the electrochemical corrosion of the MAO coating of AA7050 was studied under a silicate system exposure.
Experimental Procedures
Material and MAO Treatment
The substrate material used in the present study was AA7050 (wt%: 6.42 Zn, 2.25 Mg, 2.02 Cu, 0.13 Zr, 0.03 Ti, 0.10 Mn, 0.04 Cr, 0.11 Fe, 0.07 Si, and balance Al). The electrolyte used in this study was a silicate solution of sodium silicate (Na2SiO3) (10 g/L), and potassium hydroxide (KOH) (2 g/L). The MAO equipment is mainly composed of MAO power supply, self-made stirring system, and an electrolytic cell. The sample and the stainless steel bar are used as anode and cathode, respectively. Coatings were produced in the electrolyte for 15 min at CDs of 3, 5, 7, and 10 A/dm2. After MAO treatment, the coated specimen was rinsed in distilled water and dried in ambient air immediately.
Immersion Corrosion Test
A 3.5 wt% NaCl solution, which was prepared using analytical-grade NaCl and deionized water, was used as the experiment solution. The specimens, with dimensions of 10 by 10 by 4 mm, were polished to a smooth surface without scratches, then immersed in 3.5 wt% NaCl solutions for five days. The specimens were rinsed with acetone, washed with deionized water, and air dried after five days, then the fractured appearances and surfaces were observed by scanning electron microscopy, model JSM-6510†.
Electrochemical Test
The electrochemical polarization curve was measured using a standard three-electrode system, in which the working electrode was the AA7050 electrochemical sample, the auxiliary electrode was platinum, and the reference was a saturated calomel electrode (SCE). The specimens used for the electrochemical tests were mounted with epoxy resin to provide an exposed area of 1 cm2 and were polished with silicon carbide (SiC) papers with grits up to 1,000. The specimens were then rinsed with deionized water, degreased in acetone and dehydrated ethanol by ultrasound, and air dried. After the electrodes were immersed in 3.5 wt% NaCl solutions for 30 min, potentiodynamic polarization tests were performed at a scan rate of 1 mV/s in 3.5 wt% NaCl solutions.
Electrochemical impedance spectroscopy (EIS) tests were conducted at open-circuit potentials. EIS was conducted in the frequency range from 100 kHz to 0.04 Hz at 10 points per decade, with a perturbation amplitude of 10 mV. Before the experiment, the surface of the sample was polished to reduce errors in the test result.
Results and Discussion
Electrochemical Corrosion
Figure 1 shows the typical potentiodynamic polarization curves in 3.5 wt% solution under different CDs of AA7050 MAO coating. The potentiodynamic curves were fitted using Corrview† software in Tafel mode. Table 1 shows the results.
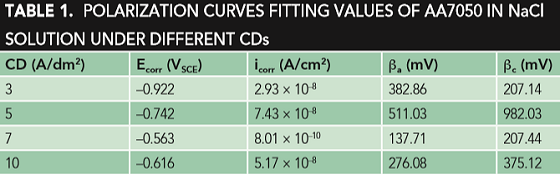
Note the several fitted curves show that when the CD is 7 A/dm2, the self-corrosion potential of the coating was increased by ~40 mV compared to that at 3 A/dm2, and at the same time, the self-corrosion current was reduced by an order of magnitude. However, when the CD continues to increase to 10 A/dm2, the self-corrosion potential decreases, the self-corrosion current increases, and the corrosion resistance is poor.
EIS Analysis

Figure 2 shows the typical EIS of AA7050 MAO coating in NaCl solution under different CDs. In Figure 2, the AA7050 MAO coating exhibits a large capacitive reactance arc in the middle and high frequency regions due to charge transfer. When the CD increases to 7 A/dm2, the radius of the capacitance arc increases gradually, indicating that the corrosion resistance of the coating increases gradually. Yu, et al.,8 considered that the presence of reactance indicates the commencement of corrosion in the initial stage.
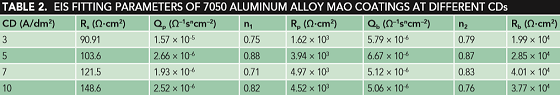
When the CD continues to increase to 10 A/dm2, the radius of the capacitance arc decreases, as well as the corrosion resistance. Figure 3 shows the equivalent circuit diagram; the corresponding component values are shown in Table 2. The higher the Rb value is, the better the corrosion resistance.9-12 Table 2 shows that when the CD is 7 A/dm2, the Rb value of the coating is obviously higher than that of other coatings, and the Rp value is also significantly higher, which further shows that the corrosion resistance of that coating is the best.13
 Morphologies of Corrosion Attack
Figure 4 shows the corrosion surfaces of AA7050 MAO coating in 3.5 wt% NaCl solution at different CDs for 120 h. The figure shows that the surface of the coating has been covered by the corrosion products because the NaCl solution invades the inside of the coating through the loose layer channel, and a large amount of loose layer and a small amount of dense layer dissolve to the corrosion.
Corrosion products are formed in the liquid, and as the immersion time increases, the corrosion products are loose. Some of the corrosion products accumulated in the pores of the loose layer are extruded by the corrosion products of the dense layer, and are dropped into the test solution, and the other part gradually accumulates to the surface of the coating.14 In addition, Figure 4(a) shows that when the CD was 3 A/dm2, there were many corrosion cracks on the surface of the coating. When continuing to increase the CD to 7 A/dm2, the pores on the surface of the coating are significantly reduced. Note that the degree of corrosion was greater with increasing the CD to 10 A/dm2. 3 A/dm<sup>2</sup>, (b) 5 A/dm<sup>2</sup>, (c) 7 A/dm<sup>2</sup>, and (d) 10 A/dm<sup>2</sup> for 120 h.")
Conclusions
1. The immersion corrosion test showed that after 120 h NaCl corrosion, the surface porosity of the coating when the CD is 7 A/dm2 is the least and the compactness is the greatest.
2. When the CD is 7 A/dm2, electrochemical experiments showed that the Ecorr of the coating reaches a maximum value (–0.563 V) and the icorr reaches a minimum value (8.01 × 10⁻¹⁰ A·cm–2) compared to the other samples, indicating that the corrosion resistance of that coating is the best.
Acknowledgment
The financial aid of the National Natural Science Foundation of China under grant No. 51871031 is gratefully acknowledged.
† Trade name.
References and About the Authors