Including salary and bonuses, the average annual U.S. compensation is $115,203, which is a slight increase of 1.29% over the average annual salary of $113,734 reported in 2015, but less than last year’s increase of 4.71%. The Canadian average annual taxable income this year is CAN$126,907, a 4.42% increase over last year’s average annual salary of CAN$121,538 and higher than the ~0.88% increase experienced by Canadian respondents in 2015. The average annual European salary declined this year to €73,000, down by ~4.13% from last year’s reported average annual salary of €76,147 and contrary to the 13.75% increase in average annual salary reported for Europe in 2015. The average annual salary for survey participants in the United Kingdom is £76,738, up 1.38% from £75,690 reported in 2015 and a turnaround from the decline (-3.81%) seen last year.
The 2016 survey results indicate that the average annual salaries for the United States, Canada, and United Kingdom are all above average when compared to the U.S. mean annual wage for engineers reported for May 2015 by the U.S. Bureau of Labor and Statistics,1 which is US$95,240.
When converted to U.S. dollars—US$1 equaled CAN$1.2815, €0.8801, and £0.6918 using currency exchange rates at press time (June 6, 2016)2—the average annual salaries can be ranked as follows:
• United States: $115,203
• United Kingdom: $110,932
• Canada: $99,039
• Europe: $82,943
Earnings Comparisons
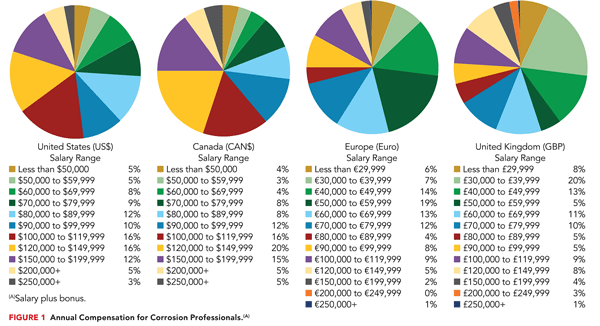
The percentage of U.S. respondents in several annual earnings ranges generally increased or remained the same compared to last year. The results for Canadian participants show percentage increases in all salary ranges. Survey results for Europe indicate percentage increases and decreases, as well as no changes. Similarly, this year’s results for the U.K. respondents also showed increases, decreases, and no changes. Average annual compensation by salary range is shown in Figure 1.

The Anatomy of a Corrosion Professional
Experience
Generally, participants earned higher average annual salaries as their years of experience increased. Across all surveys, respondents serving in the industry for 10 years or more continue to outnumber those with less corrosion experience, and those with 20 or more years of corrosion experience earned the highest average annual salaries in all regions.
Tenure and Employers
In addition to working in the corrosion profession for many years, a number of respondents have stayed with their employers on a long-term basis, with more respondents this year reporting tenure of 10 or more years. About 36% (vs. ~35% last year) of U.S., 26% (vs. ~25%) of Canadian, 26% (vs. ~23%) of European, and 30% (vs. ~16%) of U.K. participants have worked for their current employer for 10 or more years. Those who have changed jobs at least once in the past 10 years are ~30% of U.S. respondents, ~25% of Canadian respondents, ~32% of European respondents, and ~24% of U.K. respondents.
Many of the survey participants work for companies with 500 or more employees: ~67% of U.S., ~47% of Canadian, ~49% of European, and ~61% of U.K. respondents—with ~15% (United States), ~18% (Canada), ~8% (Europe), and ~8% (United Kingdom) of respondents working for companies with 100 to 499 employees.
The majority of respondents in the United States (~64%), Canada (~59%), and Europe (~61%) work 40 to 49 hours per week. In the United Kingdom, ~38% work 40 to 49 hours per week, and ~36% work 30 to 39 hours per week.
The corrosion field continues to be predominantly male; however, the survey results indicate that women comprise a slightly higher portion of the Canadian and European corrosion job force than last year. Women account for ~8% of the U.S. respondents (same as last year), ~12% of Canadian respondents (vs. ~10% last year), ~15% of European respondents (vs. ~10% previously), and ~10% of the U.K. respondents (also the same as 2015).
Education
Today’s corrosion control workforce in all regions surveyed continues to be comprised of individuals with higher education as well as corrosion-control training. About 49% of respondents in the United States, 43% in Canada, 79% in Europe, and 71% in the United Kingdom possess a bachelor’s degree or higher. The majority of survey participants report that they have attended educational, course-based training within the past 10 years: ~80% in the United States, ~85% in Canada, ~53% in Europe, and ~71% in the United Kingdom. Those with a Professional Engineer (P.E.) license comprise ~10% of U.S., ~20% of Canadian, ~27% of European, and ~23% of United Kingdom respondents. Other professional certifications, such as those from API, ASNT, AWS, CEFRACOR, CGSB, FROSIO, ICORR, NCCER, SSPC, etc., are also held by ~24% of survey participants in the United States, ~40% in Canada, ~41% in Europe, and ~49% in the United Kingdom.
Certification
Close to half of all respondents in the United States and Canada hold a NACE coating certification, and those holding a NACE coating certification in Europe and the United Kingdom are 45% and 36%, respectively. Coating Inspector Program (CIP) Level 1 continues to be the most-held NACE certification in all regions surveyed; with CP Technician following as the second most-held NACE certification in the United States and Canada, and CIP Level 2 coming up second in Europe and tied with CIP Level 1 in the United Kingdom.
Job Type
In the United States, the types of job selected by the largest percentages of respondents are again similar to survey findings from the past several years. They are engineers (~21%), quality control/quality assurance (QC/QA) inspectors (19%), and technicians/technologists (18%).
The largest percentages of Canadian respondents classified their job function as QC/QA inspectors (22%), engineers (19%), and technicians/technologists (18%), which are also comparable to previous years’ survey results.
For European participants, the jobs held by the largest number of respondents are engineers (~41%), QC/QA inspectors (~24%), and consultants (~12%).
The jobs held by the most U.K. respondents are engineers (~30%), consultants (~19%), and a tie between management and QC/QA inspectors (~14% each).
Industry
Oil and gas, as well as coatings and linings, continue to be among the dominant industries for corrosion professionals in all regions surveyed. Respondents selecting either oil and gas extraction or oil and gas pipelines/storage tanks as their company’s primary industry include ~33% in Canada, ~29% in the United Kingdom, ~27% in the United States, and ~18% in Europe. Respondents employed in the coatings and linings industry include ~19% in Canada, ~17% in Europe, ~12% in the United States, and ~11% in the United Kingdom. In Europe and the United Kingdom, 17% and 15% of respondents, respectively, also selected engineering/architectural consulting firm.
Geographic Location
At least five responses were received from participants in 42 U.S. states; six Canadian provinces; five European countries that use the Euro; and two countries in the United Kingdom.
Career Priorities
More advancement opportunities top the list for the largest percentage of respondents in the United States, Canada, and Europe when they reported which job aspect they would most like to change, which mirrors last year’s survey results. Better job security, however, is a top priority for the largest percentage of U.K. respondents, with more advancement opportunities placing second. Many U.S. and Canadian respondents rank a larger budget for corrosion control as second on their list of priorities, while European respondents feel stronger about improving access to effective corrosion control technologies.
Survey Methodology
This year, close to 1,850 respondents participated in MP’s 18th annual corrosion career and salary survey, which represents ~7% of the total number of NACE International members contacted. An independent survey development and management company conducted the survey. In April 2016, ~20,053 NACE International members in the United States, 4,008 in Canada, 1,374 in Europe (who use the Euro as their currency), and 1,160 in the United Kingdom received an e-mail with an invitation to participate and a link to their respective online survey. At the close of the survey, 1,365 U.S. surveys were completed, representing a 95% confidence level in the survey results plus or minus 2.6% for error; 316 Canadian surveys were submitted, resulting in a 95% confidence level with a margin of error of plus or minus 5.3%; 85 European members participated, for a confidence level of 95% plus or minus an error margin of 10.3%; and 80 members from the United Kingdom completed the survey, which is a 95% confidence level of plus or minus 10.6% for a margin of error.3
Highlights
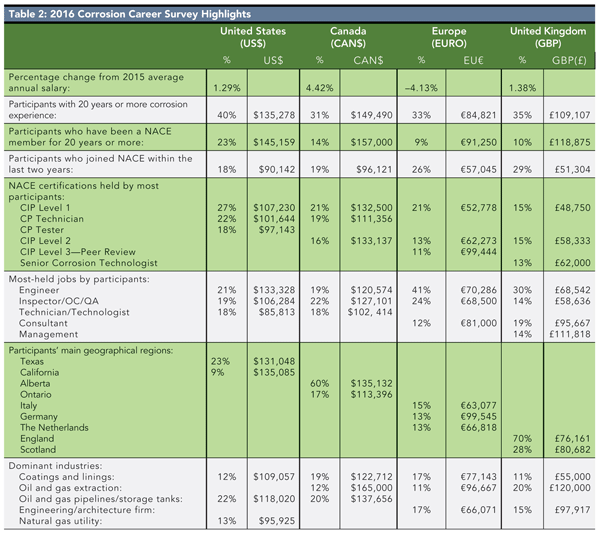
Highlights of 2016 corrosion career survey are presented in Table 2. The complete corrosion career and salary survey article can be accessed here. To all who shared the information that helped create this report for NACE members and others who work in corrosion control, the MP staff extends its appreciation and thanks.

References
1 U.S. Department of Labor, Bureau of Labor Statistics, “Occupational Employment Statistics, May 2014 National Occupational Employment and Wage Estimates, United States,” http://www.bls.gov/oes/current/oes_nat.htm#17-0000 (June 6, 2016).
2 Yahoo! Finance, Currency Converter, http://finance.yahoo.com/currency-converter (June 6, 2016).
3 The Survey System, http://www.surveysystem.com/sscalc.htm (June 6, 2016).