Cathodic protection (CP) testing is a challenge in pipeline/power line corridors. Misinterpretation of data or unreliable data can lead to either ineffective or excessive mitigation programs for these pipelines. Additional testing over conventional CP surveys may also be required.
The variation of the structure-to-electrolyte potentials and the effect of polarization cell replacement units can influence the results and conclusions on the polarization of the pipeline. To address these effects, data from a case study is analyzed to illustrate added testing procedures.
In the absence of evidence that no corrosion has occurred, the criterion for adequate cathodic protection (CP) is a polarized structure-to-electrolyte potential of -850 mV referenced to a copper-copper sulfate reference electrode (CSE) or 100 mV of polarization.
The measurement of potentials in common pipeline/high-voltage alternating current (HVAC) power line corridors can be a challenge with induced alternating current (AC) voltage. The induced AC voltage will peak at each end of the parallel section with opposite polarity and pass through zero in the middle.
An induced AC voltage equal to or greater than 15 volts is hazardous, while AC corrosion can occur at lower AC voltages. Steps must be taken to protect the public, pipeline personnel, and the pipeline itself. This is typically accomplished by installing electrical grounds at the peak AC voltage locations.
As the electrical ground creates an additional load on the CP system, a polarized cell or polarized cell replacement (PCR) is typically installed in series between the pipeline and the ground. A PCR allows AC current to pass while blocking low-voltage direct current (DC).
However, when conducting CP surveys at short interruption cycles, the PCR discharges current after interruption, thus delaying the instant-off potential. Increasing the interruption cycle time reduces the efficiency of surveys such as a close interval potential survey (CIPS).
The measurement of reliable polarized potentials on pipelines can be further complicated by a spiking effect on interruption due to the reactance of the CP rectifier, by interference from the HVAC transmission lines varying loads, and by the voltage gradients generated by the HVAC mitigation system.
The case study presented here provides a CP monitoring approach to consider when determining CP levels on a pipeline in a common corridor with HVAC power lines.
Case Study
Background
The effects described in this article’s introduction were noted on a nominal pipe size (NPS) 24 fusion-bonded, epoxy-coated pipeline 6.9 km (4.3 mi) long that parallels two 138 kV power lines for approximately 4 km (2.5 mi), and one 345 kV power line for approximately 640 m (0.4 mi) through urban and rural rocky mountainous-type terrain.
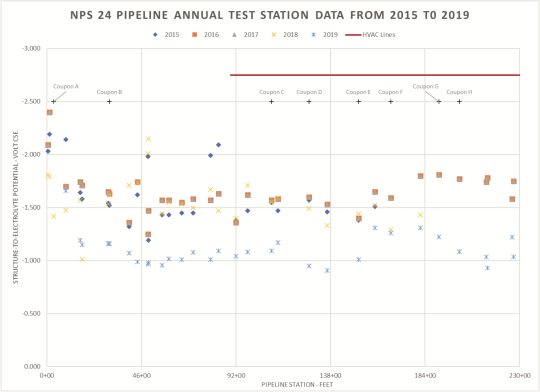
An impressed current CP system and an AC mitigation system were previously installed. The pipeline operator measures potentials annually with the CP system in operation. The annual 2015 to 2019 CP potentials are plotted in Figure 1.
While interrupting the CP system on a slow cycle, a CIPS was conducted over the NPS 24 pipeline in 2019. The purpose of the interrupted CIPS was to measure potentials at close intervals without the voltage drops generated by the CP current, i.e., infrared voltage drops or infrared error. The slow-cycle interruption allowed time for the PCR discharge current to dissipate, which was confirmed by waveform analysis at multiple pipeline test stations using different interruption cycles.
The CIPS data identified sections of the pipeline where the potentials met the −850 mVCSE criterion or were in the overprotection range. As part of the CIPS, stationary data log (SDL) measured and recorded DC and AC potentials daily to validate data collected along the pipeline.
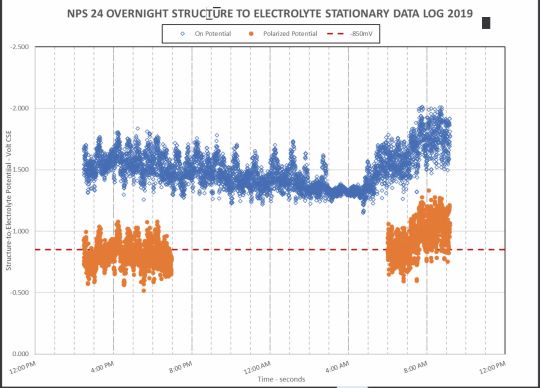
In the section where the NPS 24 shares the corridor with the two 138 kV HVAC power transmission lines, the potentials from the SDLs varied significantly over time (Figure 2), which indicated the pipeline was affected by dynamic stray current interference. Possible sources of dynamic stray current interference are namely natural (e.g., telluric), or manufactured (e.g., electric railways, industrial DC activity, and/or induced AC from HVAC transmission lines).
A telluric current is due to geomagnetically induced currents in the earth and induces varying voltages in metallic structures, such as pipelines, by the interaction of solar particles with the earth’s magnetic field. Telluric current was rejected as a cause for the stray current as the CIPS was conducted in a period of low solar activity and the typical quiet period at night with the sun on the opposite side of the earth did not occur.
Man-made electric railway or industrial stray current interference typically has repeatable patterns such as when trains or industrial activity start and stop. There were no electric railways in the area and, as there was no evidence of the second, both were rejected as the cause.
Normally, a pure AC wave would not affect the DC potential unless there is a DC component that shifts the AC sinusoidal wave from the zero axis. In this case, there are nine electrical grounds in parallel with the pipeline, each connected to the pipeline with one PCR, inserted in series at the ends of each ground.
The PCR reactance continues to impress a DC current after interruption, having the effect of delaying depolarization and the elimination of infrared voltage drops. Therefore, a corresponding effect is seen on the potentials.
To determine the true polarization of the pipeline, seven coupon test stations were installed in 2021 along the NPS 24 pipeline., The locations of the coupon test stations along the pipeline are shown in Figure 1. Each test station has two coupons: a native and a CP.
The native is left disconnected in the soil, and the CP is connected to the pipe through a switch that can be turned on or off manually. The coupon surface area is 9.03 cm2 (1.4 in2), which was selected as that of a conservative coating anomaly from past NPS 24 direct examinations. The CP or PCR current will have less influence on the CP coupon than on the pipeline when it is disconnected.
The coupon test procedures are described in the following section.
Procedure
Synchronized current interrupters were installed on the NPS 24 CP system rectifiers. The interrupters were set to a slow cycle, while the coupon-to-pipe connections were switched on and off manually.
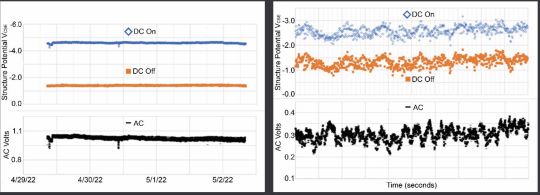
Coupon-to-electrolyte potential (i.e., coupon potential) waveforms were logged, while the CP coupon was connected and disconnected from the pipeline using the manual switch. DC potential and AC voltage SDLs were recorded at Test Station A remote from the HVAC corridor (Figure 3 left) and at Test Station E within the HVAC corridor (Figure 3 right). The operating conditions of the rectifiers were adjusted to balance the CP level along the NPS 24 pipeline.
After removing the current interrupters, the CP coupon potentials were recorded while connected to the pipeline, and then depolarization was measured for 200 seconds after disconnecting the CP coupon from the pipeline.
Discussion of Results
Balancing CP Levels
Using the coupon potentials, the CP level of the pipeline was balanced between the CP criteria and the overprotection levels to minimize possible cathodic disbondment. Test Station A and Test Station B, located one-half-mile apart, were selected for these purposes.
Test Station A, newly installed where the 2019 CIPS reported the most electronegative polarized potential at −1.424 VCSE, is near a CP rectifier. After reducing this rectifier output, the polarized coupon potential was −1.206 VCSE.
During the 2019 CIPS at Test Station B, an interrupted potential of −0.795 VCSE was reported; however, the coupon potential was −1.173 VCSE. Thus, the pipeline was likely affected by foreign voltage gradients rather than an interference current discharge.
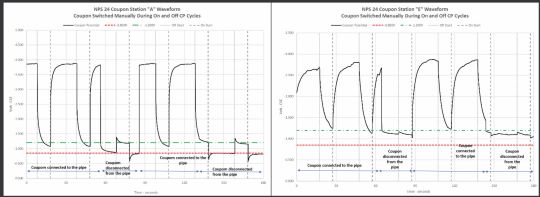
The coupon potential waveform recorded at Test Station A, next to a rectifier, found that when the CP was interrupted, the anode bed voltage gradient and the rectifier spiking effects on interruption affected the disconnected coupon potentials (Figure 4 left).
The coupon potential waveforms recorded at the coupon test stations in the section of the NPS 24 pipeline that parallels the two 138 kV HVAC transmission lines were not affected by the stray current interference (Figure 4 right). Although the polarized coupon potential was less electronegative than when connected, it still met criterion.
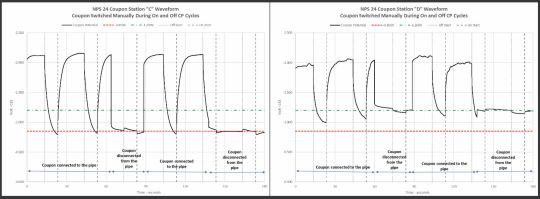
Other coupons, Coupons C and D, were affected by rectifier “spiking” voltage gradients (Figure 5). The CP interrupted potentials shifted to more electropositive values in one coupon and to more electronegative in another depending on current direction. Instant-off values were selected after these spikes subsided.
Dynamic Stray Current Interference Source
Comparing the SDL AC voltage and the DC potential remote from the HVAC (Figure 3 left) to the parallel section (Figure 3 right) showed a substantial increase in potential variations in the parallel section. This further confirmed that the source of dynamic stray current interference was from the HVAC power line.
Although the dynamic stray current interference from the HVAC power transmission lines caused variations in the pipeline potentials, the disconnected CP coupon depolarization waveforms were not affected.
Polarization Criterion (Depolarization)
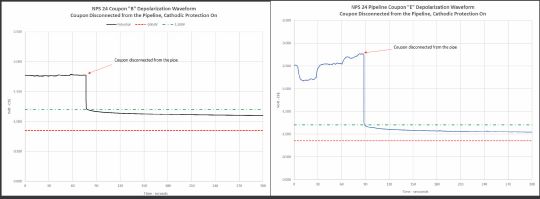
To further confirm effective CP by applying the 100-mV polarization criterion, the coupons were allowed to depolarize. The CP coupons depolarized from 119 mVCSE minimum to 279 mVCSE maximum after the CP rectifiers were adjusted, thus meeting the polarization criterion of 100 mV (Figure 6).
In-Line Inspection and Direct Examination
An in-line inspection of the pipeline section in this study found no external corrosion features. This validates the coupon results that indicated the polarized potentials continued to meet criterion during stray current events contrary to the CIPS results.
Findings and Conclusion
The following case study findings and conclusion are presented:
- A source of the dynamic stray current interference was the PCR current discharge during rectifier interruption, which was confirmed by the SDL analysis.
- Surface potential measurements especially using fast interruption cycles can yield misleading results.
- The use of stationary data logs to record potential waveforms proved to be valuable tools when evaluating pipeline polarization levels under challenging conditions, such as dynamic stray currents in pipeline/HVAC common corridors.
- The use of coupons proved to be a practical and technically sound option to determine the level of polarization of pipelines affected by dynamic stray current interference.
- The depolarization on a pipeline affected by dynamic stray current interference was measured accurately by coupons and was confirmed by the in-line inspection tool reporting no corrosion.
- Coupon potentials can be affected by anode bed voltage gradients during interruption where the CP current and/or the soil resistivity is sufficiently high, even away from the voltage gradients of the CP anode bed.
- The use of coupons can establish a CP criterion during periods of stray current or with PCRs installed.
Editor’s note: This article first appeared in the September 2024 print issue of Materials Performance (MP) Magazine. Reprinted with permission.