When discussing corrosion control through cathodic protection (CP), we can categorize the activities throughout the design life of an asset, as below:
1. Design and material selection
2. Construction and commissioning
3. Monitoring
4. Troubleshooting
The first two are one-time activities and generally not repeated. The last activity is occasional and may not occur for a long time. The most extensive, repetitive, and equally important is the third—CP system monitoring. An effective CP system should operate around the clock and throughout the year.
The number of natural gas companies operating around the globe has expanded substantially over the years. Sui Northern Gas Pipelines, Ltd. (SNGPL) in Pakistan has one of the largest distribution networks of ~130,000 kms of pipelines serving 4,458 towns and villages with a transmission network of ~9,000 kms. The pipelines and other underground structures are scattered country wide and in far-flung remote areas not always well-served by transportation infrastructure. The staff is required to visit each CP station on a monthly basis to monitor the CP parameters, which is not a trivial undertaking.
The company is operating ~1,800 CP stations installed on transmission and distribution pipeline networks in different terrain from plains to mountains and hard-to-reach areas. The monitoring of all CP stations on a monthly basis is an expensive business that involves extensive traveling of field staff, monitoring equipment, and transportation. A need to effectively monitor such a large and continuously expanding CP system at a reduced cost was identified. The research and development wing of the Corrosion Control Department of SNGPL started working to find a reliable and cost-effective solution to address the issue.
A global system for mobile communication (GSM) operated remote monitoring data transmission unit (RMU) was developed and successfully tested in the field to effectively monitor the CP system output. The unit was designed to monitor and communicate data on input current (alternating current [AC] amps), input voltage (AC volts), output current (direct current [DC] amps), output voltage (DC volts), drain point potential (DC volts), and ON/OFF status. The structure-to-electrolyte potential is measured in accordance with criteria given in NACE SP0169-2013.1 The RMU hardware includes a high-impedance voltmeter, an ammeter, a GSM module, signal conditioning/data acquisition circuitry, and is duly calibrated for accurate measurement of transformer/rectifier output. Figure 1 shows the CP monitoring system.
The RMU is housed in an IP65-rated mild steel enclosure suitable for field installation.2 The data is communicated in the form of short messaging service (SMS) through GSM. SMS is used for text messaging on mobile phones. The frequency of data communication is set at every 12 h, producing two data sets per day. The data can also be obtained by request anytime around the clock. The time for data communication for each RMU is configurable and is set per the user’s requirement.

To manage the huge quantity of data and segregate it in manageable presentations, a web-based software application was developed with the help of the SNGPL’s Information Technology Department.3 The salient features of the software application for the CP remote monitoring system (CPRMS) are as follows:
• Access to information through prior authorization
• A brief status report of overall performance of RMUs installed
• A graphical presentation or trends of an individual RMU
• Filtration of data for a desired time period
• Prompt identification of faulty sites or conditions
• Data security
• 24/7 access
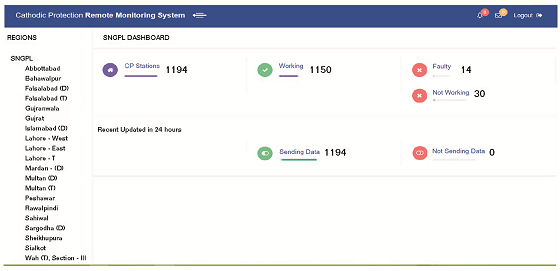
A system aggregate and summary are visible on the initial dashboard (Figure 2). The company’s network is divided into regions and sections. A list of regions is available on left side of the screen and one can access the data of an individual region by clicking on it. The data for individual features as previously outlined can be seen by clicking on it. The dashboard is automatically refreshed according to the last message received for each CP station.

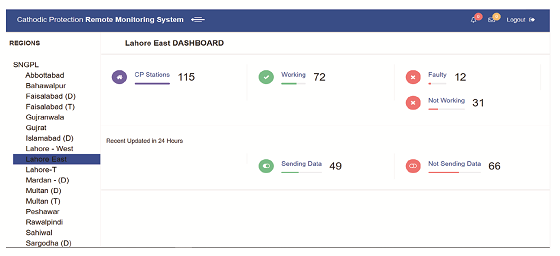
Clicking on a region, such as Lahore East, displays the following information on the dashboard (Figure 3):
• CP stations: Total number of CP stations/rectifiers
• Working: CP stations having active input AC power supply
• Not working: CP stations inactive due to AC power supply failure
• Faulty: CP station with active AC power supply, but zero output current
• Sending data: RMUs that have sent data in last 12 h
• Not sending: RMUs that have not sent data in last 12 h
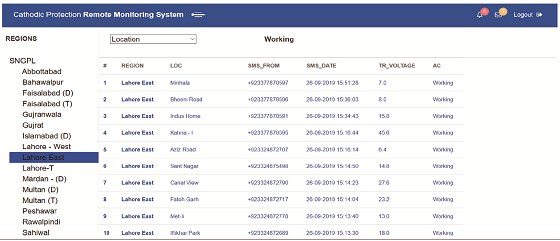
Any feature can be selected to view the list of its respective CP stations under that category. Figure 4 shows a partial list of the working CP stations in the Lahore East region.

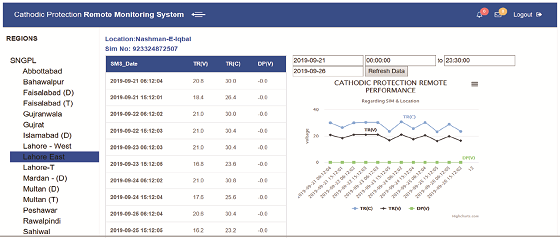
The status of an individual CP station can be accessed by clicking on the name of the CP station. A weekly status of data received with graphical representation appears on the screen. To see the historical data, select the desired dates to view the data, as Figure 5 shows.
The installation of RMUs on the majority of SNGPL CP system had been achieved and the data for each CP station are now monitored twice a day, which were previously monitored through monthly conventional site visits. The benefits of having a remote monitoring system are:
• 24/7 monitoring of CP stations
• Reduced monitoring cost
• Immediate awareness of problems
• Optimized planning of day-to-day tasks and activities
• Historic record of AC power outages/fault
• Increased flexibility in carrying out CP surveys
The web-based computer application can be accessed anywhere with a proper individual login, which has improved the level of monitoring from a site supervisor up to the head office. The system faults or problems are immediately detected, and corrective action is taken, as required. A maintenance program is devised on the basis of a far greater and long-term data set.

The success of the program resulted in considerable savings and the staff is now focused on other related activities to improve the CP system. The entire hardware design, fabrication, and data management software were carried out with available in-house staff and facilities and no outside contractors or agencies were utilized. All integrated natural gas companies with large pipeline networks can benefit from a remote monitoring CP system to improve their working efficiency.
References
1 NACE SP0169, “Control of External Corrosion on Underground or Submerged Metallic Piping Systems” (Houston, TX: NACE International, 2013).
2 BSI-BS EN 60529, “Degrees of Protection Provided by Enclosures” (London, U.K.: British Standards Institute, 2013).
3 E.W. McAllister, ed., Pipeline Rules of Thumb Handbook, 8th ed. (Oxford, U.K.: Elsevier, 2014).
The project team is comprised of Muhammad Faizan Akram, executive engineer (Corrosion); Yasir Ishaq, associate engineer; and Khalid Mehmood, dy. chief officer (IT/MIS).