Copper-based alloys are widely used in the consumer electronics industry for components such as connector contacts, shielding gaskets, and terminals. These alloys must possess unique combinations of electrical, physical, and mechanical properties that include strength, conductivity, formability, stress relaxation, and fatigue resistance. Traditionally, applications for structural alloys in military, automotive, and industrial markets have demanded corrosion resistance as a requisite characteristic. However, corrosion resistance is becoming increasingly important for consumer electronics in typical environments for such devices.
Importance of Corrosion Resistance in Consumer Electronics
Although most copper alloy components in consumer electronic devices are plated with protective layers of noble or inert metals, these surface treatments are typically very thin and microscopic defects or damage can easily expose the substrate material.1 With the increasing prevalence of handheld and wearable consumer electronic devices, the frequency and duration of exposure of the materials used in these devices to harsher consumer environments (e.g., carbonated beverages, water, and human body fluids) is also increasing. Other factors such as humidity, salt concentration, environmental pollution, and the use of incompatible solder, flux, and masking materials also can lead to corrosion. Further, evolving uses such as body-worn devices can mean closer direct contact of the metallic alloy with a consumer’s skin. The consequences of the presence of corrosion products can range from benign surface discoloration to electrical shorts, intermittent connectivity, and loose contacts due to electromigration or conductive corrosion products.2-3 In extreme cases, contact with corrosion products could also lead to skin reactions for the consumer and complete device failure.
Experimental Procedures
All testing was conducted by an independent, third-party laboratory—DNV GL in Dublin, Ohio.
Alloys Tested and Sample Configurations
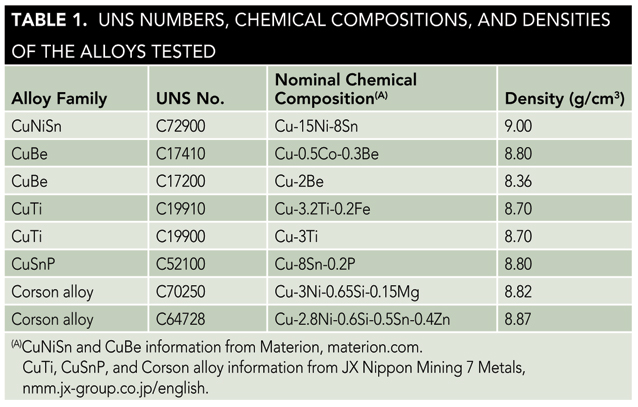
Eight copper alloys representing five commonly used copper alloy families were tested. The alloy families were copper nickel tin (CuNiSn), copper beryllium (CuBe), copper titanium (CuTi), phosphor bronze (CuSnP), and Corson alloys (CuNiSiX). Nominal chemical compositions and densities of the eight alloys tested are provided in Table 1.
Short-term immersion testing was conducted in three test solutions: a salted carbonated cola beverage, phosphate-buffered saline (PBS), and artificial human perspiration. Longer-term salt fog testing was also conducted. Samples were nominally 25.4 by 25.4 mm for the short-term immersion testing and 76.2 by 76.2 mm for the salt fog testing (Corson alloy UNS C64728 was only available as 21-mm wide strip). Duplicate samples were tested for each test type and were polished with 600 grit silicon carbide (SiC) paper and cleaned with deionized (DI) water prior to exposure. As-polished samples were dipped in isopropanol, rinsed with DI water, and dried with nitrogen gas. Samples were photographed and weighed in the polished, preexposed condition.
Test Procedures
Short-Term Immersion in Salted Carbonated Cola
A carbonated cola beverage (300 mL) was poured into a beaker at ambient temperature. Preweighed 102.0 g of sodium chloride (NaCl) was added into the beaker and placed on a stir plate. After the salt dissolved, the solution was transferred to 750 mL of additional cola, yielding a volume of 1,100 mL. The average pretest pH was 2.2. Each sample was submerged in 250 mL of solution so that it did not touch the bottom of the beaker. The samples were removed from the solution, dried, and placed in the temperature chamber set to 65 °C with 90% relative humidity (RH) for 6 h. The samples were then placed back into the temperature chamber for 2 h for a drying phase at 65 °C and RH between 25 and 30%.
Short-Term Immersion in Phosphate-Buffered Saline and Artificial Human Perspiration
The same procedure described for the salted cola test was followed, with the following solutions used instead of the salted cola: Dulbecco’s PBS
† manufactured by Sigma-Aldrich as specified in ASTM F2129,
4 and artificial human perspiration manufactured by Pickering Laboratories as specified in ISO 31602.
5 The average pH was 7.2 for the PBS and 4.7 for the artificial human perspiration.
Longer-Term Salt Fog Testing
Salt fog testing was conducted in a Model #QFOG/ SGP600† cyclic corrosion tester in accordance with ASTM B117.6 After 1,000 h, the samples were subjected to cleaning according to ASTM G1.7 During cleaning, the solution was deaerated with dry nitrogen gas to minimize base metal removal. Samples were weighed prior to exposure, post exposure/precleaning, and postcleaning. Corrosion rates were calculated as described in ASTM G1.
Results
Figures 1 through 3 show the results of the short-term exposure testing in salted carbonated cola, artificial human perspiration, and PBS, respectively.
, right: CuTi (C19900).")
, right: CuTi (C19900).")
, right: CuTi (C19900).")
The samples showing the greatest and lowest corrosion rates are presented. For each alloy, the photo on the left shows the polished sample before testing and the photo on the right shows the sample after testing. The condition of the samples at the end of the drying phase is shown. For exposures in all three test solutions, the condition of the samples between thermal cycles (i.e., before and after the drying phase) did not noticeably vary. After each of the short-term tests, the CuNiSn visually showed the least amount of change in surface appearance among all the alloys. Both the CuTi alloys (UNS C19910 and C19900) showed greater degradation in surface appearance, followed by CuSnP and the Corson alloys.
Figure 4 shows the salt fog test samples after 1,000 h. The calculated corrosion rates are presented in Table 2.
, right: CuTi (C19900).")
The results of the salt fog testing appear to follow trends similar to those observed in the short-term exposure testing.
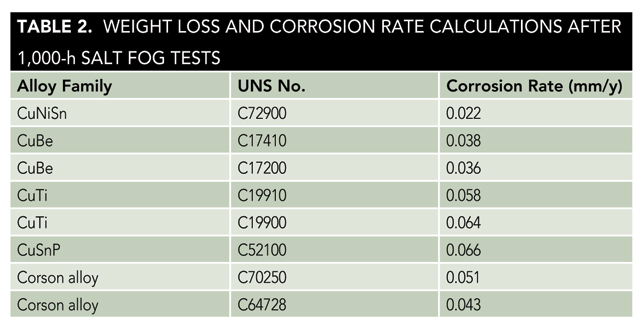
CuNiSn showed the least amount of surface corrosion products and the lowest corrosion rate (0.022 mm/y) after 1,000 h. The CuBe alloys showed corrosion rates of 0.036 and 0.038 mm/y after 1,000 h; and the Corson alloys showed intermediate corrosion resistance with corrosion rates of 0.043 and 0.051 mm/y after 1,000 h. Corrosion rates of the CuTi alloys were significantly higher, 0.058 and 0.064 mm/y after 1,000 h; and CuSnP showed the highest corrosion rate of 0.066 mm/y after 1,000 h.
Discussion
Product reliability and performance, along with functionality and design, form the basis of competition among manufacturers of consumer electronics devices. On the other hand, the design engineers face the relentless challenge of balancing the cost of materials with the threats to product warranties, brand reputation, and market perception of their products. Historically, corrosion resistance has not been a major factor in the selection of Cu alloys for such applications. However, recent reports of failures of certain popular wearable devices associated with corrosion of metallic components have raised awareness about the importance of corrosion resistance in addition to mechanical and physical properties.
In consumer electronics applications, the formation of even minor surface corrosion products (e.g., tarnishing) during transportation or storage can be sufficient cause for failure or rejection, due to either the effect on product appearance and aesthetics or surface properties. This is in contrast with other markets and industries, where the effect of corrosion on the structural integrity of the component may be of greater importance than its visual and surface properties. The results of the current study show there can be a wide range of corrosion behavior in commonly used Cu alloys. It follows that the careful selection of Cu alloys for the design of consumer electronics components, based on corrosion resistance along with other properties, can ultimately lead to an overall cost-optimized and reliable design.
Summary
Short-term exposures in environments of interest to the consumer electronics industry, and longer-term salt fog corrosion testing were conducted on eight commonly used Cu alloys.
Short-Term Exposures
• CuNiSn showed the least change in surface appearance after testing in salted cola, artificial human perspiration, and PBS solutions.
• CuTi alloys, followed by CuSnP and CuNiSi (Corson) alloys showed the greatest degradation in surface appearance.
Salt Fog Testing
• Visually, CuTi alloys showed the highest amount of surface corrosion and CuNiSn showed the least amount of surface corrosion products after 1,000 h.
• CuNiSn showed the lowest corrosion rate of 0.022 mm/y after 1,000 h.
• CuBe alloys showed corrosion rates between 0.036 to 0.038 mm/y after 1,000 h.
• The Corson alloys showed intermediate corrosion resistance with corrosion rates of 0.043 and 0.051 mm/y after 1,000 h.
• Corrosion rates of CuTi alloys were significantly higher, between 0.058 to 0.064 mm/y after 1,000 h.
• CuSnP showed the highest corrosion rate of 0.066 mm/y after 1,000 h.
References
1 R.J. Morrissey, “Porosity and Galvanic Corrosion in Precious Metal Electrodeposits,” Electrochemical Techniques for Corrosion Engineering, R. Baboian, ed. (Houston, TX: NACE International, 1985).
2 R. Ambat, M.S. Jellesen, D. Minzari, U. Rathinavelu, M.A.K. Johnsen, P. Westermann, P. Møller, “Solder Flux Residues and Electrochemical Migration Failures of Electronic Devices,” Proc. of Eurocorr 2009, held September 610 (London, UK: EFC, 2009).
3 IPC, “Electrochemical Migration: Electrically Induced Failures in Printed Wiring Assemblies,” IPCTR476A, 1997.
4 ASTM F212915, “Standard Test Method for Conducting Cyclic Potentiodynamic Polarization Measurements to Determine the Corrosion Susceptibility of Small Implant Devices” (West Conshohocken, PA: ASTM International, 2008).
5 ISO 31602: 2003, “Watch Cases and Accessories—Gold Alloy Coverings—Part 2: Determination of Fineness, Thickness, Corrosion Resistance and Adhesion” (Geneva, Switzerland: ISO, 2003).
6 ASTM B11711, “Standard Practice for Operating Salt Spray (Fog) Apparatus” (West Conshohocken, PA: ASTM, 2011).
7 ASTM G103 (2011), “Standard Practice for Preparing, Cleaning, and Evaluating Corrosion Test Specimens” (West Conshohocken, PA: ASTM, 2011).
†Trade name.