Average annual salaries reported in 2015 for corrosion professionals in the United States, Canada, and Europe reached new highs, while those in the United Kingdom decreased slightly compared to last year, according to the results of the 17th annual corrosion career and salary survey sponsored by Materials Performance magazine. More than 2,100 respondents participated this year, representing ~8% of the total number of NACE International members contacted. The survey was conducted by Newlio, an independent survey development and management company.
Average Annual Salaries
The average annual U.S. compensation including salary and bonuses is $113,734, an increase of 4.71% over the average annual salary of $108,615 reported in 2014, but less than last year’s increase of ~5.3%. The average annual Canadian taxable income this year is CAN$121,538 (US$97,377), a modest increase (0.88%) over last year’s average annual salary of CAN$120,480 and significantly less than the ~11.4% increase experienced by Canadian respondents in 2014. The average annual European salary increased this year to €76,147 (US$85,856), up by ~13.75% from last year’s reported average annual salary of €66,944, and a substantial reverse of the 2.5% decrease in average annual salary reported for Europe in 2014. The average annual salary for survey participants in the United Kingdom is £75,690 (US$116,256), down 3.81% from £78,690 reported in 2014. At press time (June 4, 2015), the currency exchange rates were as follows: US$1 equaled CAN$1.2481, €0.8869, and £0.6511.1 Table 1 lists average annual corrosion salaries for the past five years.
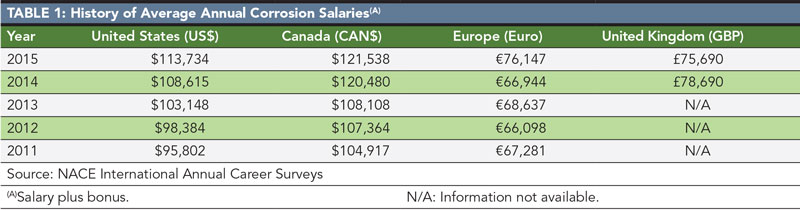
The 2015 survey results indicate that the average annual salaries for the United States, Canada, and United Kingdom are above average as compared to the U.S. mean annual wage of US$93,630 for engineers reported for May 2014 by the U.S. Bureau of Labor and Statistics.2
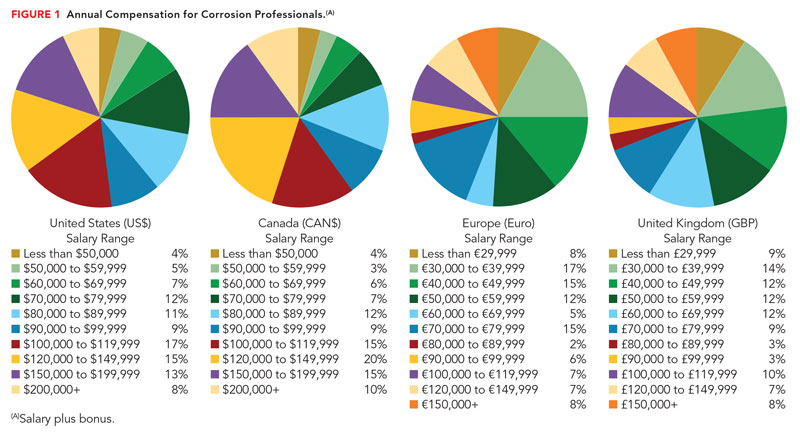
The percentage of respondents in several annual earnings ranges generally increased or remained the same compared to last year, although there were declines in some ranges. For U.S. respondents, survey results indicate that ~72% earned $80,000 or more (compared to ~68% last year); ~61% earned $90,000 or more (compared to ~56%); ~52% earned $100,000 or more (compared to ~46%); ~20% earned $150,000 or more (compared to ~18%), and ~8% earned $200,000 or more (compared to ~6%).
The results for Canadian participants show that ~80% (compared to ~76% in 2014) earned CAN$80,000 or more annually; ~68% (compared to ~67%) earned CAN$90,000 or more; ~59% (same as last year) earned CAN$100,000 or more; ~24% (compared to ~25%) earned CAN$150,000 or more; and ~10% (compared to ~8%) earned CAN $200,000 or more.
Survey results for the Europe show that ~61% of participants (compared to ~56% last year) earned an annual salary of €50,000 or more per year; ~49% (compared to ~42%) earned €60,000 or more; ~44% (compared to ~32%) earned €70,000 or more; ~29% (the same as last year) earned €80,000 or more; ~27% (compared to ~22%) earned over €90,000 or more; and ~22% (compared to ~16%) earned over €100,000 or more.
When comparing results for the United Kingdom, ~66% of respondents (compared to ~64% last year) earned £50,000 or more; ~53% (compared to ~56%) earned £60,000 or more; ~41% (compared to ~49%) earned £70,000 or more; ~32% (compared to ~37%) earned £80,000 or more; ~28% (compared to ~29%) earned £90,000 or more; and ~25% (compared to ~26%) earned over £100,000. Average annual compensation by salary range is shown in Figure 1.
Average Annual Salaries by Certification and Education Level
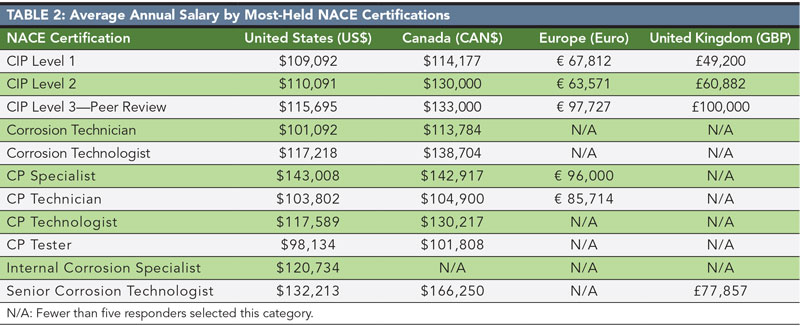
Today’s corrosion control workforce in the United States, Canada, United Kingdom, and Europe continues to be comprised of many individuals with corrosion-control training as well as higher education. The majority of respondents hold at least one NACE certification, with the percentage of certification holders increasing this year for the United States, Europe, and the United Kingdom. Coating Inspector Program (CIP) Level 1 continues to be the most-held NACE certification in all regions surveyed, with CIP Level 2 and Level 3 following as the second and third most-held NACE certification, respectively, in Europe, and the United Kingdom. Table 2 lists average annual salaries for the most-held NACE certifications.
Additionally, the majority of survey participants have attended educational, course-based training in the past 10 years: ~79% in the United States, ~85% in Canada, ~80% in Europe, and ~82% in the United Kingdom. Other professional certifications, such as those from API, ASNT, AWS, CGSB, FROSIO, ICORR, SSPC, etc., are also held by some of the respondents: ~24% in the United States, ~35% in Canada, ~41% in Europe, and ~51% in the United Kingdom. Those with a Professional Engineer (P.E.) license comprise ~9% of U.S., ~18% of Canadian, ~22% of European, and ~24% of United Kingdom respondents. About 50% of respondents in the United States, 44% in Canada, 71% in Europe, and 70% in the United Kingdom also possess a bachelor’s degree or higher. Average annual salaries by education level are shown in Table 3.

Average Annual Salaries by Experience
Across all surveys, respondents serving in the industry for 10 years or more outnumber those with less corrosion experience; however, the number of participants who have worked in corrosion for four years or less has increased for each region.
The percentage of participants involved in corrosion prevention and mitigation for 10 years or more are ~60% for the United States, ~50% for Canada, ~51% for Europe, and ~66% for the United Kingdom. Of those, ~39% in the United States, ~30% in Canada, ~29% in Europe, and ~40% in the United Kingdom have more than 20 years of corrosion experience. Those working in corrosion control for four years or less account for ~22% of U.S. respondents, ~33% of Canadian respondents, ~20% of European respondents, and ~17% of U.K. respondents.
Generally, respondents earned higher average annual salaries as their years of experience increased; and those with 20 or more years of corrosion experience earned the highest average annual salaries in the United States, Canada, and the United Kingdom. Table 4 shows average annual salaries by years of corrosion experience.

Average annual salaries for respondents in the United States and Canada also increased as years of NACE membership increased, with the highest average annual salaries reported for those with 20 or more years with NACE. For the other regions surveyed, this trend was not observed; however, for both Europe and the United Kingdom, the highest average annual salary by NACE membership was earned by survey participants with 10 to 19 years of membership with NACE. Table 5 shows average annual salary by years of NACE membership. In May 2015, the total number of NACE members worldwide was 36,072, a 6% increase over last year.

Average Annual Salaries by Employer and Work Week
In addition to working in the corrosion profession for many years, a number of respondents have stayed with their employers on a long-term basis, although the percentages have decreased compared to the 2014 survey.
About 35% (vs. ~37%) of U.S., 25% (vs. ~29%) of Canadian, 23% (vs. ~32%) of European, and 16% (vs. ~31%) of U.K. participants have worked for their current employer for 10 or more years. Those staying with the same employer for 20 years or more are ~18% (vs. ~21%) for the United States, ~14% (vs. ~16%) for Canada, ~9% (vs. ~15%) for Europe, and ~6% (vs. ~18%) for the United Kingdom. About 19% of U.S., 22% of Canadian, 16% of European, and 14% of U.K. respondents have been with their employer less than two years. Those who have changed jobs at least once in the past 10 years are ~62% of U.S. respondents, ~59% of Canadian respondents, ~53% of European respondents, and ~64% of U.K. respondents. Those who are self-employed comprise ~8% for the United States, ~12% for Canada, ~23% for Europe, and ~21% for the United Kingdom.
Many of the survey participants work for companies with 500 or more employees: ~60% of U.S., ~55% of Canadian, ~44% of European, and ~53% of U.K. respondents—with ~17% (United States), ~15% (Canada), ~17% (Europe), and ~12% (United Kingdom) of respondents working for companies with 100 to 499 employees. For average annual salaries by company size, see Table 6.

The majority of respondents—~63% in the United States, ~62% in Canada, and ~63% in Europe—work 40 to 49 hours per week. In the United Kingdom ~47% work 40 to 49 hours per week and ~35% work 30 to 39 hours per week. Table 7 shows average annual salary by hours worked per week.

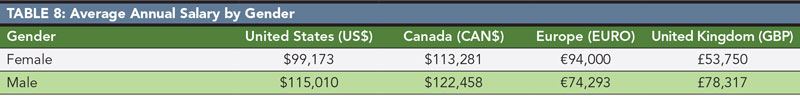
According to the survey results, the corrosion field continues to be predominantly male. Women comprise ~8% of the U.S., ~10% of the Canadian, ~10% of the European, and ~10% of the U.K. respondents. Table 8 lists average annual salaries by gender.
Average Annual Salaries by Job Type
In the United States, the types of job selected by the largest percentages of respondents are again similar to survey findings from the past several years. They are technicians/technologists (~22%), engineers (~21%), and quality control/quality assurance (QC/QA) inspectors (~18%). The positions with the highest average annual salaries are professor/teacher ($146,429), management ($135,684), and consultant ($125,000). The largest percentages of Canadian respondents classified their job function as technicians/technologists (~26%), engineers (~21%), and QC/QA inspectors (~16%), which are also comparable to previous years’ survey results. The highest Canadian average annual salaries are CAN$156,410 for management, CAN$135,980 for QC/QA inspectors, and CAN$130,000 for sales/marketing.
For Europe participants, the jobs held by the largest percentages of respondents are QC/QA inspectors (~29%), engineers (~24%), and sales/marketing (~13%); and the highest average annual salaries are reported for chemists (€127,500), management (€122,143), and sales/marketing (€103,077). The jobs held by the largest percentages of respondents in the United Kingdom are engineers (~27%), consultants (~25%), and QC/QA inspectors (~18%). The highest average annual salaries are reported for professor/teacher (£135,000), consultant (£91,207), and management (£86,111). Table 9 lists most-held job types and corresponding average annual salaries.

For corrosion professionals in the United States, Canada, Europe, and the United Kingdom, oil and gas as well as coatings and linings continue to be dominant industries. Respondents selecting oil and gas pipelines/storage tanks as their company’s primary industry included ~26% in the United States, ~20% in Canada, and ~10% in Europe, while ~22% of U.K. respondents selected oil and gas extraction as their company’s primary industry. Respondents employed in the coatings and linings industry include ~28% in Europe, ~16% in the United Kingdom, ~14% in Canada, and ~12% in the United States.
The highest average annual salaries in the United States by industry are reported for pulp and paper ($175,000), oil and gas extraction ($149,903), and refining ($144,348). For Canada, the highest average annual salaries by industry are reported for original equipment manufacturer (CAN$180,000), metals and mining (CAN$155,000), and oil and gas extraction (CAN$150,882). The chemical processing industry commanded the highest average annual salary in Europe at €122,500, followed by oil and gas extraction at €116,429, and original equipment manufacturer at €95,000. In the United Kingdom, the industries with the highest reported average annual salaries were oil and gas extraction (£116,000), original equipment manufacturer (£100,000), and engineering/architecture consulting (£79,231). See Table 10 for all average annual salaries by dominant company functions.

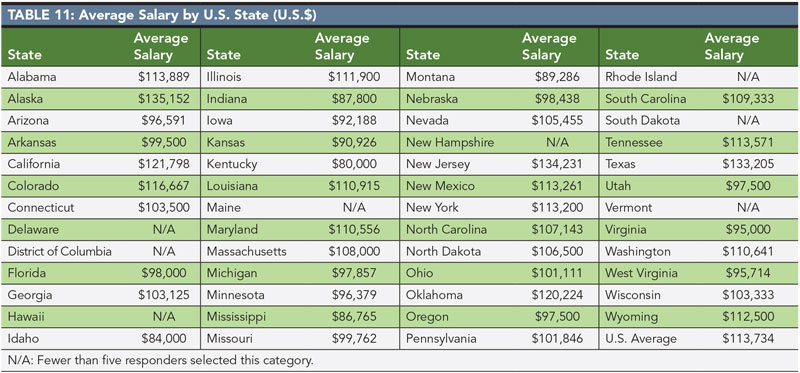
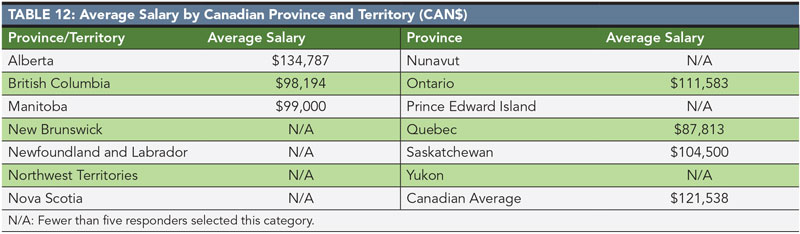
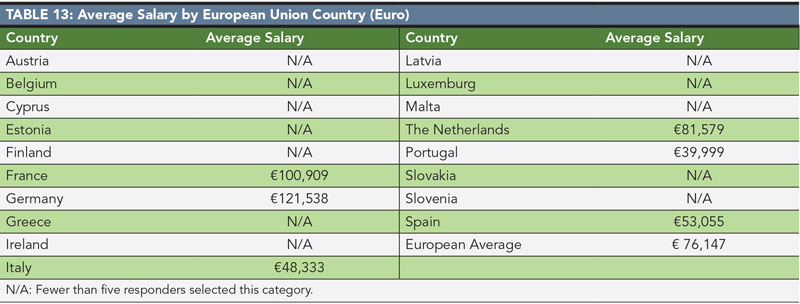
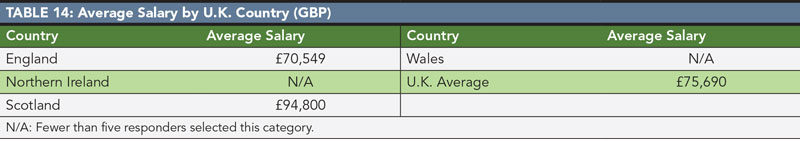
Average Annual Salaries by Geographic Location
At least five responses were received from participants in 43 U.S. states; six Canadian provinces; six European countries that use the Euro; and two countries in the United Kingdom. Tables 11 through 14 depict average annual salaries by U.S. state, Canadian province and territory, European country, and U.K. country respectively

Survey Methodology
In April 2015, ~19,175 NACE International members in the United States, 3,811 in Canada, 1,180 in Europe (who use the Euro as their currency), and 1,088 in the United Kingdom received an e-mail with an invitation to participate and a link to their respective online survey. At the close of the survey, 1,588 U.S. surveys were completed, representing a 95% confidence level in the survey results plus or minus 2.4% for error; 330 Canadian surveys were submitted, resulting in a 95% confidence level with a margin of error of plus or minus 5.2%; 102 European members participated, for a confidence level of 95% plus or minus an error margin of 9.3%; and 116 members from the United Kingdom completed the survey, which is a 95% confidence level plus or minus 8.6% for a margin of error.3
To all who shared the information that helped create this report for NACE members and others who work in corrosion control, the MP staff extends its appreciation and thanks.
References
- Yahoo! Finance, Currency Converter, http://finance.yahoo.com/currency-converter (June 4, 2015).
- U.S. Department of Labor, Bureau of Labor Statistics, “Occupational Employment Statistics, May 2014 National Occupational Employment and Wage Estimates, United States,” http://www.bls.gov/oes/current/oes_nat.htm#17-0000 (June 4, 2015).
- The Survey System, http://www. surveysystem.com/sscalc.htm (June 4, 2015).